We may earn a commission if you make a purchase through the links on our website.
The Best Mainframe Monitoring Tools
UPDATED: December 30, 2024
Mainframe monitoring is an entirely different ball game. Mainframes process high volumes of transactions and input/output operations in parallel and exceptionally quickly, and they usually serve mission-critical applications. In this post, we’ll go through the best mainframe monitoring tools. With these tools, system admins should be able to continuously monitor the performance and health of a mainframe and its influence on the services and applications.
Organizations that invest in mainframes can’t afford to lose these machines’ valuable output and resources. An underutilized mainframe can turn out as a complete waste of money. So, mainframes must run at their peak performance; they need to be continuously and fully operational during business hours and, in most cases, running 24/7.
Here is our list of the best mainframe monitoring tools:
- Datadog Infrastructure Monitoring Cloud-based observability solution with infrastructure monitoring, APM, logs management, and more. Integrates with z/IRIS software for expanded mainframe observability.
- Dynatrace Complete observability, intelligent monitoring, and automation platform capable of monitoring IBM z mainframe.
- AppDynamics by Cisco Leader full-stack observability platform that integrates with z/OS IBM z “APM Connect”.
- Pandora FMS Enterprise All-in-one monitoring solution that uses a z/OS plugin to collect mainframe data.
- Broadcom’s CA Mainframe software Leader in mainframe operations management solutions, Broadcom provides SYSVIEW to monitor and manage various mainframe subsystems.
- Splunk Enterprise Provides organizations with observability, security, and business intelligence, integrates with Syncsort Ironstream to monitor mainframe sources.
- IntelliMagic Vision for z/OS Monitors your z Series IBM mainframe, covering both hardware and software, and provides alerts when problems are detected.
- BMC Automated Mainframe Intelligence (AMI) Leader in mainframe solutions, BMC AMI, provides automated intelligence to monitor the performance of z/OS mainframes.
- Instana APM platform by IBM with automated, context, and actionable enterprise observability. It integrates with z/OS, db2, CISCS, and more.
The Best Mainframe Monitoring Tools
Our methodology for selecting mainframe monitoring tools
We reviewed various mainframe monitoring tools and analyzed the options based on the following criteria:
- Support for continuous monitoring and automated recovery
- Integrations with other monitoring platforms
- Analyzes mainframe performance over time
- Graphical interpretation of data, such as charts and graphs
- Free trial period, a demo, or a money-back guarantee for no-risk assessment
- Good price that reflects value for money when compared to the functions offered
1. Datadog Infrastructure Monitoring
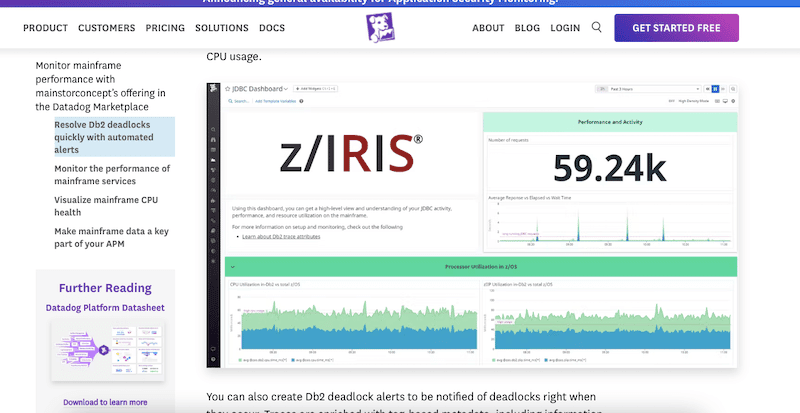
Datadog is a SaaS-based observability solution. The cloud-based services range from infrastructure monitoring, APM, cloud monitoring, log management, security, digital experience, and more. Datadog’s infrastructure monitoring platform allows system admins to keep track of servers, including mainframes and their resources. Datadog was named a Leader in Gartner’s 2021 MQ (Magic Quadrant) for APMs.
Key Features:
- Complete Infrastructure Overview: Deploys anywhere across hybrid, IOT, on-premises, and multi-cloud environments for an overview, and get deep details from various environments
- Log Management: Offers a centralized approach to troubleshooting, optimizing, and analyzing security threats of any scale
- APM: Application performance monitoring, providing AI-powered code level tracing which detects issues in mobile applications, browser, and backend services to find the exact root cause
- Security Monitoring: Drill downs 15-month-old data to know whether the past issues conflict with current ones, allowing to easily understand issues in the cloud environment as the data is represented in graphical form
Why do we recommend it?
We recommended Datadog because of its versatile cloud-based system. It helps users to comprehensively track server, service, and application activities. It provides specific monitoring extensions for mainframes and concurrently monitors other infrastructure elements. Datadog will also help you in quick troubleshooting by using service operations with resource capacities like RAM and disk space. Furthermore, by providing custom detection rules in its cloud SIEM, Datadog goes above and beyond typical monitoring. This offers robust system security by sending proactive alerts and security notifications when it finds any odd activities.
The Datadog Infrastructure Monitoring solution can be expanded to monitor IBM z series mainframes. The Mainstorconcept’s z/IRIS software is a mainframe observability plug-in explicitly built to provide performance monitoring mainframe data to third-party tools. z/IRIS provides IBM z/OS mainframe observability data (with OpenTelemetry) to the Datadog infrastructure monitoring solution. It provides access to vital infrastructure metrics, error messages, and alerts so that you can evaluate your mainframe’s health and its impact on apps and services. The z/IRIS solution is available in Datadog’s Marketplace.
Who is it recommended for?
This tool is mostly used by developers, operational teams, and security experts looking to efficiently manage application security threats. It guarantees proactive security measures by providing ongoing, real-time monitoring of vulnerabilities and threats across several application types, including web apps, serverless applications, and APIs. The best thing about this solution is its efficacy, which is increased by its integration with APM distributed traces and code-level context. Hence, the specialists can create and manage secure applications in production environments.
Pros:
- Best for Cloud Security: Most suitable tool for cloud security because data is collected and analyzed from thousands of organizations in order to understand the latest trends of security structure.
- Error Tracking: Monitors and group critical errors across the web, mobile devices, and other background running applications.
- Continuous Profiler: Monitors the entire performance of your code and detect slow lines of codes, resources, and other services.
- Sensitive Data Scanner: Aims to discover and classifies data based on sensitivity by using filters and configuring data to scan critical information.
Cons:
- Complex API: If you are a non-tech user, the set-up phase of this tool can be tough as it involves understanding complex API integrations and threads. Also, users find this tool expensive when it comes to monitoring high-volume data.
Free ($0), Pro ($15 per/host per/month), and Enterprise ($23 per/host per/month). Sign up for a 14-days free trial of Datadog.
2. Dynatrace
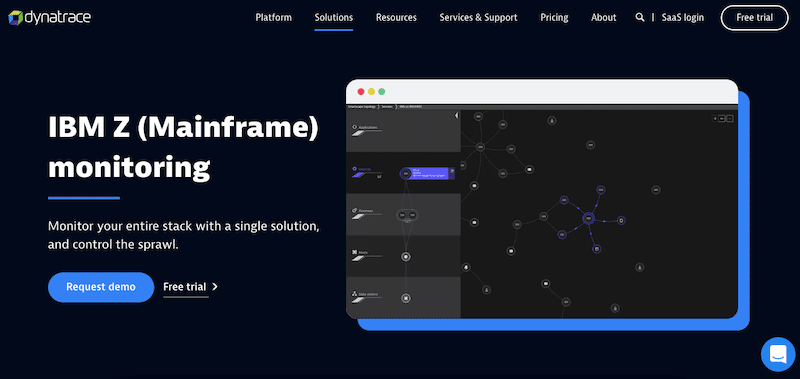
Dynatrace is all-in-one observability, AIOps, automation, and intelligence monitoring platform. It automatically discovers, maps, and monitors the entire stack. Dynatrace provides insights into the app’s performance, its underlying infrastructure, and user experience, leveraging its AI causation engine (Davis) and automation capabilities. The Dynatrace offering has been named a leader in 2021 in Gartner’s MQ for APM.
Key Features:
- Custom Solutions: Users can create and share custom applications that utilize insights gathered from various sources, including observability, security, and business data.
- Business Analytics: Helps make informed decisions using real-time analytics, giving clear visibility into business operations.
- Automation: No more manual work, automating ticket creation or updates, and alerts the relevant teams, reducing alert fatigue and false positives for developers.
- Improved Digital Experience: Top-notch digital experience monitoring to users across all channels, including mobile, web, IoT, and APIs.
Why do we recommend it?
We recommend Dynatrace because it offers powerful automation capabilities. You can automate a variety of procedures with Dynatrace to improve the efficiency and smoothness of your operations. It brings all of your data together using dynamic mapping, advanced artificial intelligence (AI), and a special data lakehouse to provide immediate insights and automation. Eventually, users can see and comprehend your surroundings in real-time, which gives you important information about how well your systems are operating. This will help you to understand your users and connections in a better way.
Dynatrace is one of the best mainframe monitoring tools that allow IBM z monitoring. You can install Dynatrace’s OneAgent, which is responsible for collecting all monitoring mainframe data on z/OS-based IBM z mainframe platforms and achieving observability. The OneAgent for z/OS comes in five different modules, the z/OS Data Collection subsystem (zDC), zRemote, and Java code, CICS code, IMS code modules.
Who is it recommended for?
If you are a business or organization that wishes to better understand the significance of the numerous events that your IT systems generate on a daily basis, you are advised to use Dynatrace. Dynatrace Grail automatically preserves your data's context, which supports robust analytics, AI-powered root cause analysis, and the contextualization of logs to traces. This eliminates the requirement for manual work, mistake-prone manual event correlation, and labeling throughout your whole IT stack. In simpler terms, this tool helps to improve performance and identify issues quickly and accurately.
Pros:
- Security Protection: Best at discovering, prioritizing, and shielding against both known and unknown vulnerabilities in real-time.
- Unified Observability: Easy cloud complexity, comes with a unified observability platform powered by causal AI where users can see comprehensive insights and automation capabilities.
- Scalable: Use and analyze data from any source through scalability, easily meeting the needs of diverse environments and workloads.
- Innovative App Development: Helps in the easy creation and sharing of custom apps that use insights from observability, security, and business data; hence, users can easily collaborate.
Cons:
- Lack of Support for Cloud-Based Environments: Some users have reported that Dynatrace's support for cloud-based environments is lacking in certain areas, which is a challenge or limitation if users use this platform in a cloud-centric setup.
Relevant licenses are; Infrastructure monitoring (which starts at $22/month) and Full-stack monitoring (which starts at $74/month). Both allow a maximum of 8GB per host and are billed annually. Register to Dynatrace to get a 15-day free trial.
3. AppDynamics
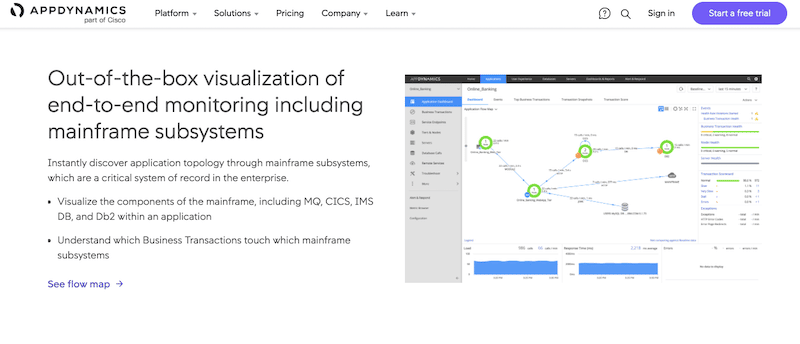
AppDynamics by Cisco is another leader in APM and full-stack observability platforms. Its product allows systems admins to monitor the entire stack, including business, users, applications, infrastructure, network, and security. Cisco’s AppDynamic is also a leader in the APM market, according to Gartner’s 2021 APM Magic Quadrant.
Key Features:
- Full Stack Performance Coverage: Helps in technical and business decisions by correlating performance metrics with key business metrics like conversions.
- Efficient Digital Experience: Flawless user experience by visualizing the digital interactions between your users and your business.
- Real-Time Problem Detection: Easily spot every application issue in real-time, pinpointing root causes from third party APIs down to code-level issues.
- Infrastructure Optimization: Visualizes and optimizes every component of your infrastructure, including servers, databases, and hybrid or cloud-native environments, to ensure optimal application performance.
Why do we recommend it?
AppDynamics from Cisco can link application performance to business outcomes and customer experience. By prioritizing important issues before they affect customers, you will notice more seamless operations and higher customer satisfaction. The platform also provides Smart Code Instrumentation, which enables users to effortlessly adjust to changes in the application environment and set everything up in a matter of minutes. For proactive and efficient performance management, we found AppDynamics is the best option due to its agility and alignment with business objectives.
AppDynamics is a fantastic z/OS mainframe monitoring tool. It improves the visibility of your mainframe’s applications by integrating with z/OS-based IBM z APM (Application Performance Management) Connect. IBM z Connect is implemented on z/OS to collect transaction tracking mainframe data from vital z/OS subsystems. This solution works on-premises and via SaaS-based tools.
Who is it recommended for?
AppDynamics is widely used by a wide range of sectors and businesses. It also serves insurance firms by providing real-time application performance monitoring, which helps them to navigate complexity efficiently. This tool also perfectly fits the requirements of cloud migration projects and benefits government organizations by providing them visibility into application performance. In addition, retail companies also use this tool to optimize e-commerce performance and strengthen their digital strategy.
Pros:
- Granular Monitoring: Monitors logs and metrics in detail, enabling a deeper understanding of why issues occur rather than just how they impact performance.
- User-Friendly Interface: Straightforward interface that provides total visibility into application, database, and infrastructure performance over varying timeframes.
- Alert Configuration: Easily defines alert thresholds based on metric baselines and streamline root cause analysis (RCA) of application code during incidents.
Cons:
- Configuration Complexity: Configuring multiple regions with identical AppDynamics software packages becomes time-consuming and tedious, which will ultimately affect users' efficiency.
Infrastructure Monitoring Edition ($6/month /CPU Core), Premium Edition ($19/month /CPU Core) including APM, Enterprise Edition ($90/month /CPU Core) including APM. Sign up to AppDynamics to get a 15-day trial.
4. Pandora FMS Enterprise
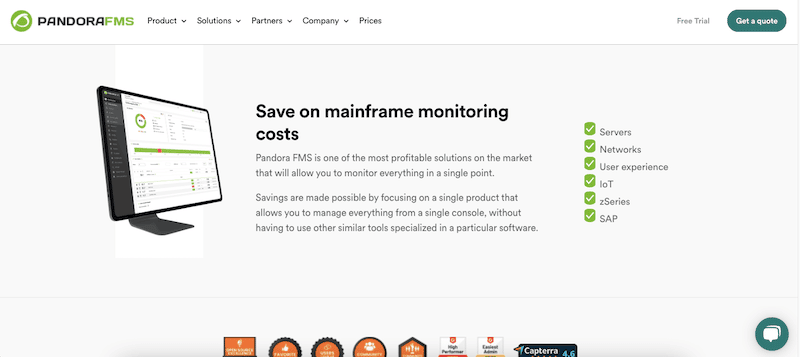
Pandora Flexible Monitoring System (FMS) is an all-in-one visual monitoring solution for APM, virtual, remote control, synthetic, UEM, IoT, logs, network, and of course, mainframes. The Pandora FMS Enterprise edition is an excellent mainframe monitoring tool because it collects and displays information from z/OS systems from a single platform.
Key Features:
- Network Monitoring: Scans and visualizes your network equipment, allowing you to understand the full structure of your network through detailed maps.
- UX Monitoring: Monitors your application's overall performance and individual steps to ensure an optimal user experience.
- Log Management: Identifies issues quickly by collecting and storing logs of various types, including Windows events, for efficient searches and alerts.
- Server and Application Monitoring: Monitors a wide range of servers, including mainframes, IBM-i, Unix, Windows, Android, and Linux, and supports multiple platforms and offers custom solutions for various data sources.
Why do we recommend it?
Pandora is highly recommended because of its extensive monitoring features, and its suitability to a variety of requirements. It helps in effective management, and gives a dynamic environment with remote access to workstations or servers. It is the best choice for companies seeking a helpdesk to support and make customer service operations more efficient. In the end, any business can increase productivity and boost customer satisfaction with Pandora FMS Enterprise.
To monitor a mainframe using Pandora FMS, you don’t need to install an agent on the mainframe. Pandora FMS z/OS uses a plugin that collects mainframe data through HTTP requests to the RMF Data Portal monitor. The Pandora FMS z/OS’s plugin extracts mainframe data from sources like Sysplex, LPAR, or others.
Who is it recommended for?
Pandora FMS is used by various organizations and professionals seeking a versatile monitoring solution. It serves a diverse group of users, including network administrators, system administrators, and IT managers. Pandora FMS is ideal if you want to control network equipment, servers (Linux and Windows), virtual environments, applications, and databases. It will provide you with both remote and agent-based monitoring capabilities. Users can view collected data in reports and graphs and set up alerts to handle any issues that develop. Overall, it's an invaluable tool for proactive IT management.
Pros:
- 500+ Integrations: Includes a wide range of integrations, providing real solutions to everyday problems, collaborating with customers, and covering current technologies used in production environments worldwide.
- 24/7 Support: Access quick answers, connect with experts, and participate in online forums and courses to learn alongside the community.
- In-Depth Understanding: Users can totally understand every component, whether obtained from suppliers' cloud services, which makes it easier to identify areas in need of optimization and improvement.
Cons:
- Overwhelming Nested Menus: Users say that when nested menus are present in large quantities, they can become overwhelming and make it difficult for users to navigate effectively and locate the needed features or options.
The Pandora FMS z/OS monitoring is only available with the Enterprise edition. Contact Pandora FMS to get a quote. Get a cloud-based, fully-functional Pandora FMS Enterprise trial for 30 days.
5. Broadcom’s CA Mainframe software
Broadcom offers a variety of mainframe operations management solutions. One of these tools is Broadcom's SYSVIEW Performance Intelligence, which provides real-time visibility into your mainframe's performance and health. Broadcom SYSVIEW breaks down silos and allows access to mainframe data across different environments using secure and open APIs. The tool enables you to monitor and manage mainframe subsystems, including z/OS, JES, Unix System Services, CICS, CTG, z/OS Connect, MQ, and IMS.
Key Features:
- Comprehensive Mainframe Management: Provides a range of tools for complete mainframe management, including performance monitoring, application development, and security.
- Application Development: Provides tools and utilities for mainframe application development, helping developers create, test, and deploy mainframe applications efficiently.
- Performance Monitoring: Tracks the performance of mainframe systems, identifies bottlenecks, and optimizes resource usage.
- Security Management: Comes with robust security management features to protect mainframe systems and data from threats and unauthorized access.
- Integration and Automation: Makes your mainframe operation easier as it supports integration with other mainframe and enterprise systems, as well as automation capabilities.
Why do we recommend it?
We recommend Broadcom because it is best at collaboration, alignment, and decision-making across business operations and technology functions, particularly in areas like ValueOps, DevOps, and AIOps. Furthermore, Broadcom's storage connectivity solutions will help you in maximizing server speed and uptime since they serve as basic technologies for hyperscale data center operations. Broadcom's CA Mainframe software enables enterprises to maximize performance and efficiency across their mainframe installations.
Broadcom also provides a Mainframe testing and quality tool so that DevOps teams can perform continuous testing in mainframe applications and simplify app analysis with visual debugging. Another mainframe monitoring tool is Broadcom's Workload Automation, which proactively monitors and manages enterprise workloads running on mainframes.
Who is it recommended for?
Broadcom's semiconductor and infrastructure software products are recommended in a variety of industries and domains. Their portfolio is category leading, and services vital industries including cloud, data center, networking, internet, wireless, storage, industrial, and corporate software. Broadcom's wireline solutions, in particular, are well suited to dealing with technological issues at various levels of network infrastructure. Broadcom's unique fiber optics and chip solutions meet the diverse needs of organizations across industries, making their products highly recommended for enterprises looking for dependable and advanced networking solutions.
Pros:
- Tailored for Complex Enterprise Environments: Meets demands of complex enterprise environments with robust features and capabilities to handle intricate setups.
- Multi-Cloud Automation and ERP Support: Offers seamless management across various cloud platforms. Additionally, it integrates well with ERP frameworks.
- Developer-Friendly Automation: Beneficial for in-house development teams to automate tasks and workflows and improves productivity.
Cons:
- Security Risks: Previously Broadcom has faced security breaches, raising security concerns.
The Base version starts at $5000 per site, including hardware, software, and health mainframe monitoring, and Db2 report for z/OS is $7500 per site. For further pricing information, consult with Broadcom directly. Contact Broadcom's mainframe software division to learn how to get started.
6. Splunk Enterprise
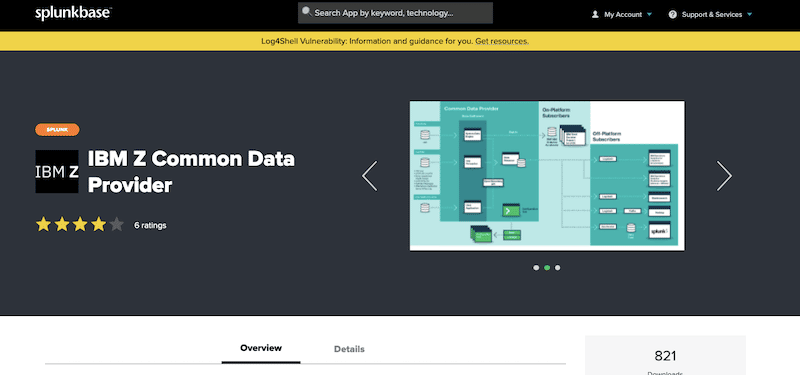
Splunk is the ‘one' data platform for all your security and observability needs. The platform integrates with virtually anything, including public clouds, apps, services, on-prem data centers, third-party tools, and edge tools. It also collects their logs, metrics, and traces. The Splunk collection mechanisms deliver unified security and full-stack observability to a single place.
Key Features:
- Data Collection: Collects data from various sources, including logs, metrics, and events.
- Search and Investigation: Comes with great, powerful search capabilities, allowing you to search through large volumes of data to find specific information or patterns.
- Real-Time Monitoring: Provides you with real-time data monitoring to detect and respond to issues as they occur.
- Alerting and Notification: Users can set up alarms for certain conditions and receive notifications when those conditions are met.
Why do we recommend it?
Splunk Enterprise will help you to easily identify the root cause of problems and offer AI-directed troubleshooting. We recommend splunk because it allows to pinpoint the most likely source of problems or slowness affecting customers and services the most, allowing for quicker problem-solving. Furthermore, it provides easy navigation from traces to logs and even to the exact line of code causing the problem, which expedites the debugging process and enables prompt resolution for every transaction.
Splunk makes it a fantastic mainframe monitoring tool because it provides flexibility, as there are many ways to send mainframe data to Splunk Enterprise. The first way is using the IBM Common Data Provider for z Systems Data Receiver (which is deployed on the same system where Splunk Enterprise is). The second way is using the HTTP Event Collector (HEC) functions on Splunk, which is easier but more resource intensive. The third and most popular way is using the third-party tool Syncsort Ironstream, which integrates security and operational machine data from different mainframe sources right into Splunk.
Who is it recommended for?
Splunk Enterprise is recommended for DevOps teams that need dynamic alerting features. Dynamic alerting allows teams to establish alerts based on static thresholds, abrupt changes, or historical anomalies, decreasing alert storms and simplifying alert administration. Furthermore, Splunk APM's ‘Always On' code profiling offers detailed analysis of code-level performance, assisting in the identification of bottlenecks and performance optimization in both cloud-native and monolithic apps.
Pros:
- Code-Level Visibility: Offers deep analysis of code-level performance and helps troubleshoot bottlenecks and optimize performance in various applications.
- Service Mapping: Dynamically-generated service maps provide comprehensive visibility into service interactions, dependencies, and performance, empowering DevOps teams with valuable insights.
- Business Workflows: Allows the grouping of end-to-end traces based on common services or tags to track important business transactions and other microservices affecting the work.
- Smart Dynamic Alerting: DevOps teams can set alerts based on static thresholds, sudden changes, or historical anomalies
Cons:
- Difficulty in Implementation: The issue with this tool is optimizing searches, especially for users with little expertise with Splunk. This may impede effective issue troubleshooting and solutions.
The cloud-based observability price starts at $65 per host/month, billed annually. For more information on the Splunk Enterprise platform, contact Splunk. Splunk offers a free trial for 14 days.
7. IntelliMagic Vision for z/OS
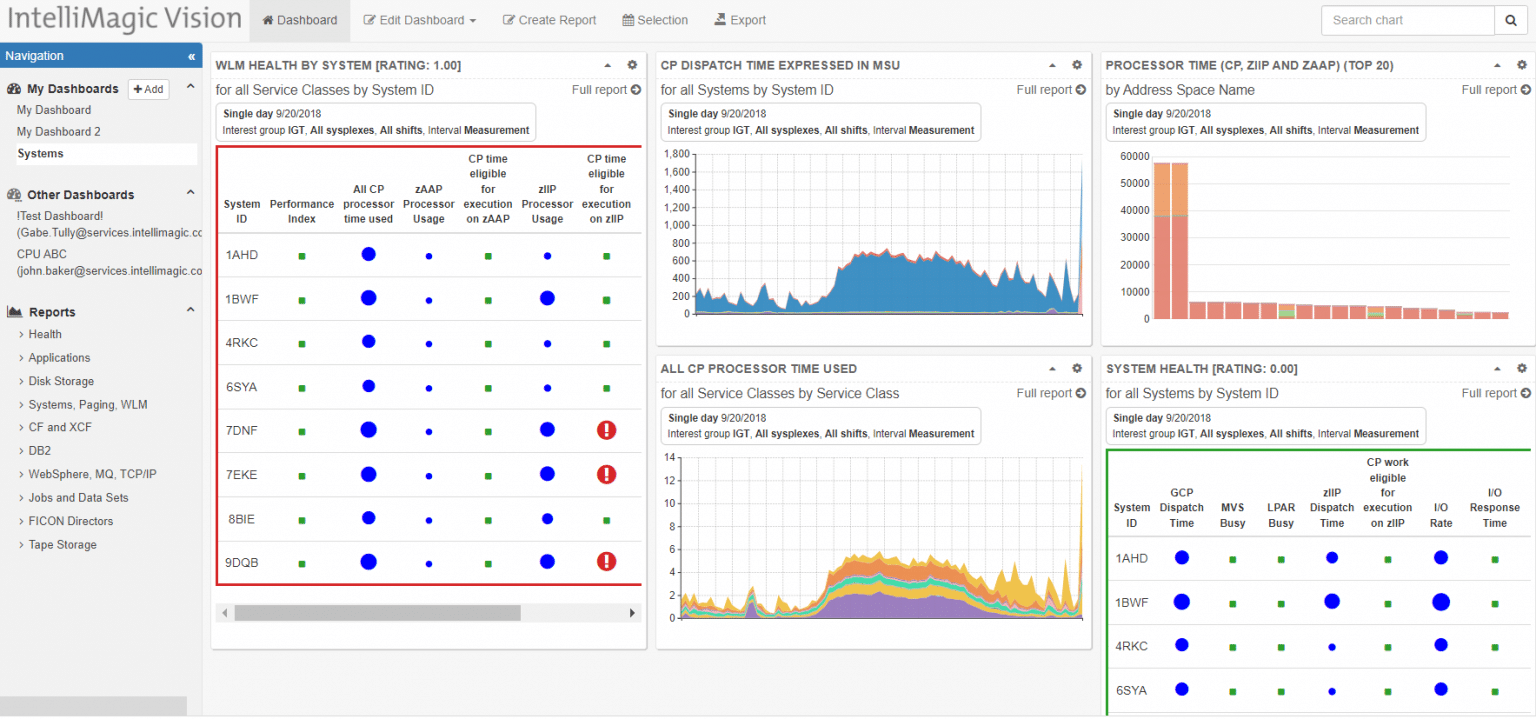
IntelliMagic Vision for z/OS is an adaptable monitoring platform for IBM z Series mainframes. The package is able to monitor the hardware as it operates and the software that runs on a mainframe. You can customize the dashboard so the exact system features that the package tracks is up to you. It is also possible to choose the format in which each metric is displayed.
Key Features:
- Risk Detection and Health Insights: Comes with built-in artificial intelligence and 700 key z/OS metrics, which smartly detect risks and provides users with health insights to prevent potential risks in the future.
- Automated z/OS Anomaly Detection: Automatically identifies problems and highlights in the change detection view section.
- Interactive GUI with Higher Visibility: Users don't need to stress about coding because this tool has a great GUI and offers intuitive visibility.
- Dynamic Report Customization: Users can view, analyze ad-hoc, and edit reports easily without the need for complicated code.
Why do we recommend it?
We recommend IntelliMagic Vision for z/OS for its AI-driven analytics. It is best at proactive monitoring and management of z/OS environments. You can use over 700 key z/OS metrics to identify potential risks to performance and availability. This tool will benefit you by preventing disruptions and helping you reduce costs. Experts love this tool because it preserves the reliability and availability of mainframes and ensures the organization's optimal system performance. Moreover, it also has built-in artificial intelligence and expert domain knowledge, so you can look at the insights to optimize z/OS systems management.
Although this system is limited to tracking IBM z/OS mainframes, it can also watch network activity by monitoring its own network card for network traffic. The mainframe creates its own TCP/IP ‘network traffic' to move data between components and these are also monitored.
Who is it recommended for?
IntelliMagic Vision is suggested for both novice employees and seasoned professionals. It is the best replacement if you are looking for a solution like automated analytics driven by artificial intelligence for antiquated reporting. Using pre-existing expert knowledge, this tool evaluates important parameters and assigns performance and efficiency ratings. Its cloud delivery further guarantees instant access without requiring maintenance, which makes it the perfect answer for efficient operations in any setting.
Pros:
- Quickly Solves Problems: Gets to the root of the analytical path to identify the massive volume of data, and fixes it ASAP.
- Improved Collaboration in the Organization: Dashboard is user-friendly and customizable, and users can easily share the reports among the team, and team members can customize the reports according to the organization's needs.
- SaaS delivery: SaaS-based so users can quickly deploy and use this tool; they don't need to deal with SMF data issues. Also, users can access IntelliMagic consulting services when needed.
- Helps to Reduce Cost: You can always rely on this tool for complete visibility of software and hardware without any hardware installation need or service delivery cost.
Cons:
- Resource Intensive: The analysis of monthly trends and cyclical patterns may require significant computing resources, potentially slowing down system performance or increasing the workload on the mainframe.
IntelliMagic doesn’t publish a price list. Start by registering for a free demo and quote of IntelliMagic Vision for z/OS.
8. BMC Automated Mainframe Intelligence (AMI)
BMC initially started around 1980 as a specialty software developer for IBM mainframes. But later, BMC started to create software for managing, automating, and monitoring mainframes (along with distributed systems). Now, BMC develops software for the autonomous digital enterprise, creating products for automation, service management, DevOps, AIOps, security, and orchestration.
Key Features:
- Predictive Analytics: Uses advanced predictive analytics to anticipate and prevent issues before they occur.
- Machine Learning: Machine-learning capabilities and continuously learns from mainframe performance data to improve efficiency and accuracy in problem detection and resolution.
- Dynamic Thresholding: Adjusts performance thresholds based on real-time data under changing conditions.
- Root Cause Analysis: Conducts in-depth root cause analysis to identify the underlying reasons for issues, facilitating effective problem resolution.
- Intelligent Automation: Offers intelligent automation capabilities to improve your mainframe management tasks and optimizes resource utilization.
Why do we recommend it?
We recommend BMC Automated Mainframe Intelligence as it can benefit enterprises in several ways. For starters, it can help see what's going on throughout the system, automatically solving problems, and predicting future issues. With the help of this too, teams can resolve issues before they become serious. Moreover, you can rely on it for collaboration among diverse parts of a firm, and deliver better client experiences.
BMC provides a robust mainframe monitoring tool for enterprises, known as the Automated Mainframe Intelligence (AMI)— an entire product line. BMC’s AMI uses automated intelligence to measure and improve the performance of z/OS-based mainframes. It relies on Machine Learning (ML) technology to improve the management of your mainframes by sending alarms and taking actions without manual intervention.
Who is it recommended for?
BMC Automated Mainframe Intelligence is an excellent solution for IT professionals looking to make their jobs easier and more efficient. It's especially useful if you need to consolidate data from multiple sources and determine how well your services are performing. Thanks to features such as AI-powered event sorting and speedy detection of the core problem, it's easy to figure out what's important and repair it quickly. In brief, BMC Automated Mainframe Intelligence is ideal for professionals looking to streamline their digital workflow.
Pros:
- Faster Deployment and Testing: Accelerates testing and deployment to code improvement. It provides continuous insight and benchmarks to drive process improvements.
- Valuable Insights Sharing: Helps users identify performance and security issues and respond quickly and correctly across platforms.
- Continuous Uptime: Ensure continuous uptime and easy management and minimize complexity
- 24×7 Data Availability: Offers an 85% faster data refresh rate, enhancing operational efficiency and ensuring timely access to critical information.
- Robust Business Protection: It protects mainframes from vulnerabilities, insider threats, and data theft by offering real-time security management.
Cons:
- Not Suitable for Small Networks: this tool might not be suitable and reliable choice for small networks, as its robust features and capabilities are designed primarily for larger and more complex mainframe environments.
Try a free 14-day BMC AMI Security trial.
9. Instana
Instana is a native APM platform from IBM that provides automated, context, and actionable enterprise-level observability. The platform can help monitor hybrid and multi-cloud environments with its full-stack cloud and infrastructure monitoring. The acquisition of Instana by IBM 2021 brought powerful observability capabilities into IBM, including a collection of application traces, logs, metrics, dependencies, automated instrumentation, and AI-based analysis— all a perfect fit for mainframe monitoring.
Key Features:
- Fully Automated Real-Time Observability: Automaticallys gather continuous, detailed data at one-second intervals, and users can see insights into mobile, web, applications, and infrastructure.
- Full-Stack Observability: Comes with a small agent on each device that will find and track everything on that device, like how well apps are working.
- 300+ Supported Technologies: Connects with over 300 different technologies to monitor and collaborate with other monitoring tools.
- Effective Remediation: Smart alerts based on thresholds, automatic detection, and correlation of events, issues, and service incidents. It identifies the likely root cause of each incident, resulting in faster mean time to resolution (MTTR).
Why do we recommend it?
We recommend IBM's Instana because it improves your understanding of your surroundings and speeds up the generation of fresh thoughts. If you want to make your customers happier by providing you with a clear perspective of every encounter choose this tool. You can improve things even more for them. It helps organizations to generate new ideas faster which performs better and gives profitable results.
Today, Instana is one of the best mainframe monitoring tools, mainly because of its broad support for IBM technologies. Instana APM for z/OS introduced IBM observability especially to help eliminate the infamous IBM z blind spot. In addition, Instana integrates IBM technologies, including z/OS, db2 on IBM z, Linux and IBM z, zHMC, CICS, and IMS.
Who is it recommended for?
This tool is mostly used by experts and companies working in complex cloud environments. It's ideal for monitoring your hybrid cloud system's health and performance. Everyone benefits from its flexible pricing and discounts for larger users. Using Instana can help specialists make the most of their cloud migration, ensuring that everything works smoothly and efficiently.
Pros:
- Out-of-the-Box Traffic Information from OpenShift: Instana provides readily available traffic information from OpenShift, simplifying monitoring and management tasks.
- Integration with Turbonomic: Seamless integration with Turbonomic enhances monitoring capabilities, allowing for a comprehensive view of the infrastructure.
- Easy App Definition: Instana makes it easy to define applications instantly, streamlining the set-up process and saving time.
- Detailed Issue Tracking: Users can gain valuable insights using this app. It offers detailed and in-depth tracking of issues to troubleshoot it.
Cons:
- AI Integration and Prediction: Some users may find the AI integration and prediction features lacking in effectiveness or accuracy, potentially impacting the reliability of automated insights and predictions.
The price starts at $75 per host/per month, and is billed annually. Sign up to Instana and get a 14-day free trial.
The Challenges of Mainframe Monitoring
Mainframe vendors usually ship their mainframes with built-in OS-native monitoring systems and onboard hardware sensors to keep track of the entire mainframe. But these onboard sensors and OS-native monitoring systems are bound to keep track of the single mainframe.
When monitoring multiple mainframes, it can be challenging and complex to keep track of every single component in all mainframes. In addition, It can also be challenging to manage and monitor services that extend beyond a mainframe and across multiple environments. Without the flexibility, IT organizations can quickly become siloed.
Mainframe Monitoring Tools FAQs
What to look for in a Mainframe Monitoring Tool?
To solve most of the challenges mentioned above, today’s mainframe monitoring tools come as solutions from observability or APM platforms. These platforms extend monitoring (and management) across multiple environments, from mobile devices and mainframes to multi and hybrid clouds.
Examples are observability plug-in solutions such as the z/IRIS, which integrates your mainframe’s z/OS client to an observability tool like Datadog. Integrating your mainframe to such tools allows DevOps access to valuable insights and added visibility into the mainframe systems. DevOps and IT teams will know how mainframe systems perform for all their business applications and their availability.
Look for the following:
- Support the traditional mainframe components A mainframe monitoring tool must be capable of integrating to IBM z/OS and monitoring its subsystems, including IBM Customer Information Control System (CICS) or DB2. For example, Datadog, Instana, Dynatrace, and AppDynamics provide fantastic integration.
- Real-time monitoring A real-time monitor should keep track of the processor, memory, and I/O on a foundation level. Real-time monitoring may include automation to help the system watch thresholds and events and react. Real-time monitoring allows admins to diagnose and detect immediate problems but can impact the mainframe’s performance with added overhead (if misconfigured).
- Post-processor monitoring Some mainframe monitoring tools can process and analyze large amounts of mainframe data after the fact. These monitors help keep track of trends, capacity planning, demand analytics, or data summaries.
- Monitor applications and how they are delivered IT admins or DevOps teams need to know how their mainframe is performing for their business applications to keep up high availability. Mainframe monitoring tools can help keep track of mainframe traces (calls and services) and metrics. They can also track transactions and DB statements. Collect transaction mainframe data from vital z/OS subsystems.
- Agent vs. agentless Running an agent on a mainframe may introduce overhead and wasted resources. So mainframe agents must be lightweight and unobtrusive. Agentless methods (such as SNMP or HTTP) can help with easier monitoring but may also introduce some overhead on the network. Dynatrace uses a lightweight OneAgent, whereas Pandora FMS does not.
What are some common add-ons and extensions for Mainframe systems?
- IBM CICS (Customer Information Control System)
- IBM DB2 (Database 2)
- IBM MQ (Message Queueing)
- IBM IMS (Information Management System)
How can I view Mainframe Monitoring data remotely?
Mainframe Monitoring data can be viewed remotely using tools such as IBM's OMEGAMON, which provides a web-based interface for accessing performance data and metrics.
What are some common metrics to monitor for Mainframe systems?
- CPU utilization
- Memory usage
- Disk I/O and throughput
- Network traffic
- Transaction response time