We may earn a commission if you make a purchase through the links on our website.
Wifi Heat Map Software & Tools for Site Surveying and Troubleshooting Wireless Networks

UPDATED: January 16, 2024
Buying a powerful Wifi receiver/transmitter will not necessarily improve your weak signals and dead zones. Getting a pair of Wifi bridges will not always improve performance; on the contrary, they can create signal leakage, which comprises security. Without proper planning and mapping, your wireless network design has a high chance of failing.
Mapping is the key.
In a Wireless Local Area Network “WLAN,” the radio wave signals are difficult to grasp and visualize. Wireless signals can be affected by physical objects, radio/electrical interference, and even the environment. A single mirror and a concrete wall can decrease the signal over 75%.
How can you know where your coverage area is? Where are your dead zones? How can you tell whether your signal is leaking?
Here is our list of the best Wifi Heat Map Software:
- SolarWinds Wifi Heat Map – EDITOR'S CHOICE This attractive tool overlays the signal strength of your Wifi APs on an floorplan of your premises. It also shows the locations of all of the endpoints in the office – click on one to see its address details. Runs on Windows Server.
- Acrylic Wi-Fi Heatmaps This WiFi analysis system creates a heatmap over the layout of your premises and performs signal strength investigations with recommendations of how you can improve your Wifi service. Runs on Windows.
- NetSpot This Wifi heatmap creator is available in free and paid versions and it will portray wireless signal strength over a layout of your location. Runs on Windows and macOS.
- VisiWave Site Survey This wireless signal mapping service will help you see unauthorized devices and Wifi leakage as well as a floorplan of your premises with the signal footprint shown on it. Runs on Windows.
- AirMagnet Survey PRO This is a comprehensive wireless network monitoring service that keeps track of traffic statistics while also showing a visual representation of the office network signal footprint. Available for Windows and macOS.
What is a Wi-Fi heatmap?
A Wifi Heatmap is a two-dimensional graphic representation of the signal strength in a Wifi network. It shows the coverage of wireless signals in different colors portrayed in a real map of an office layout, floor, or even a metropolitan area.
A heatmap also gives a quick summary of information about the wireless network and its connected clients.
Having a visual map gives the network admin amazing insights on how to adjust the wireless Access Points “APs” to improve signal coverage and avoid dead zones. Heatmaps can also help wireless engineers when doing a site survey and planning for capacity.
The Best WiFi Heatmap Software & Tools
Wifi Heatmap software automates the coverage mapping process. You need to upload an office plan or blueprint, walk around with the connected client to let the software collect data, and the software will automatically create the map.
Finding the right software can be challenging. That is why we came up with the six best Wifi heatmap tools to help in your decision.
Our methodology for selecting a Wifi heatmap tool
- We reviewed the market for Wifi heatmap software and analyzed options based on the following criteria:
- Visual representation of the location’s floorplan
- Signal footprint overlay
- Color-coded signal strength depiction
- Option to trial different AP positions
- Live tracking of mobile devices
- A free trial or a demo that provides an opportunity to assess the package before buying
- Value for money from a package that is offered at a reasonable price considering the functions that it offers
With these selection criteria in mind, we identified some useful Wifi heatmap options, including some that are integrated into network performance monitoring packages.
1. SolarWinds Wifi Heat Map with NPM
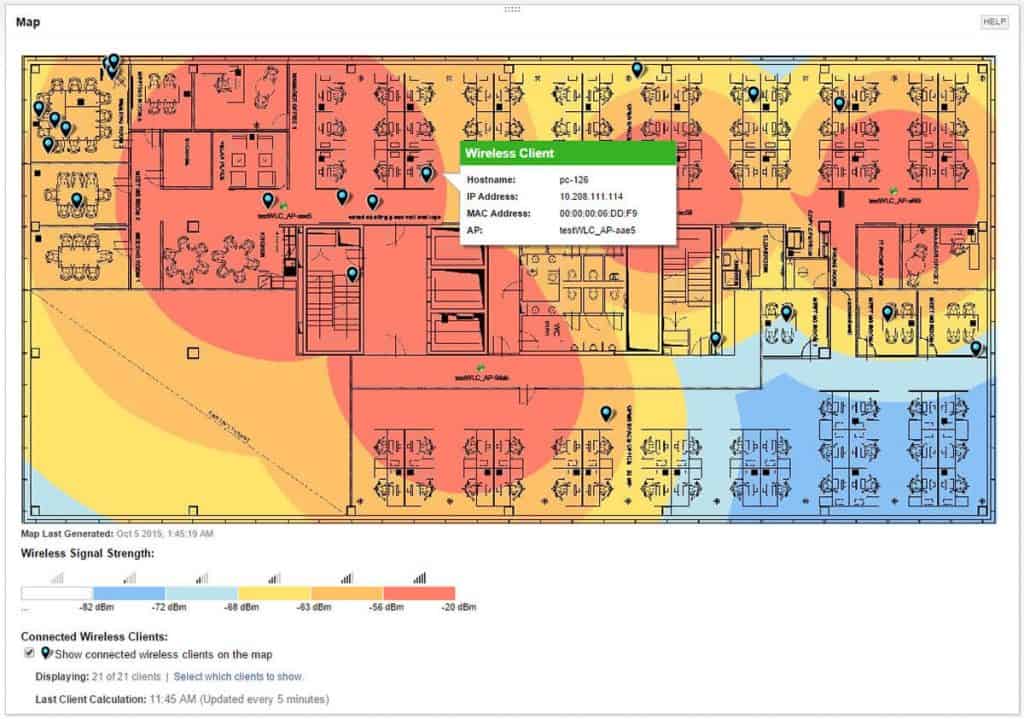
SolarWinds Wifi Heat Map comes with the Network Performance Monitor “NPM,” which is an advanced network and performance monitoring software for on-premises, hybrid, and cloud infrastructure.
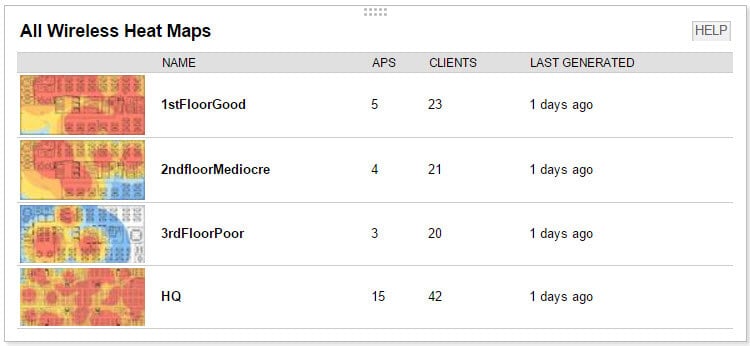
With the Wifi HeatMap from SolarWinds, you can create custom heatmaps. Start with a manual site survey of the wireless signals so that the tool can record it on the surface of a blueprint or layout. NPM with Wifi Heatmaps will poll the signal strength from clients and APs and generate dynamic Wifi heatmaps.
Key Features
- Generate automatic Wifi heatmaps
- Troubleshoot dead zones
- Find and track the location of mobile clients
Why do we recommend it?
The SolarWinds Wifi Heat Map is part of the Network Performance Monitor. The whole NPM package provides constant network device status monitoring and will warn technicians as soon as component issues arise. This service detects signal strength and can plot signal footprints on an office plan that you feed in.
With the map, you can visualize wireless coverage, find where are the dead zones, and optimize them accordingly. The tool collects information from APs and their clients and shows their signals in a colored format. Hot (red), represents where the signal is strong, and cold (blue) represents where the signal is weak. The tool is also capable of finding and tracking the location of mobile devices within the map (as shown in the screenshot below).
NPM with Wifi Heatmaps is only supported by Windows Server 2008 R2 SP1, Windows Server 2012 and 2012 R2
Who is it recommended for?
This is a great choice for a company that has both wired and wireless networks on site. The tool has extensive facilities for monitoring wired networks and it will discover all equipment, including your wireless APS. This package creates a network inventory and draws up a network topology map.
Pros:
- Highly scalable enterprise-focused tool
- Supports detailed reporting for heatmaps and site surveys
- Utilizes a number of templates to recreate accurate coverage based on brand name equipment
- Alerting is easy to configure and helps alert to issues before they impact network performance
- Can be used by MSPs to providing heat mapping as a service
- Integrates well into other SolarWinds tools
Cons:
- Feature-rich requires knowledge of heat mapping and wireless network to fully utilize
EDITOR'S CHOICE
SolarWinds Wifi Heat Map is our top pick for Wifi heat map software because it is able to locate all of the endpoints in the office and show them on an inputter floor plan as well as displaying the wireless footprint with signal strength. This package is bundled into the Network Performance Monitor, so you can reach over your entire LAN with the same software bundle.
Download: Start 30-day Free Trial
OS: Windows Server
2. Acrylic Wi-Fi Heatmaps
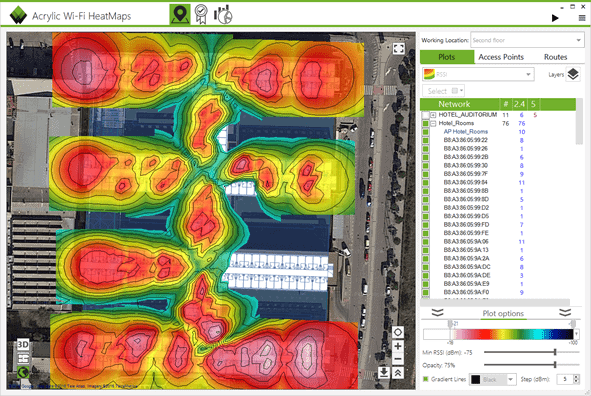
Acrylic Wifi Heatmaps is a site surveying and Wifi planning tool. It is designed to provide WLAN coverage mapping and RF analysis. It can analyze the 2.4 and 5 GHz frequency bands and supports active/passive site surveying.To start a site survey, define the location of the wireless signals. Upload your floor plans or perimeters of a geographical area into Acrylic Wi-Fi Heatmaps. If you don’t have a blueprint, you can create it within the platform. You can draw walls, furniture, and even identify the materials to make it more real.
The tool will begin to measure Wifi signal levels, scan for devices nearby (including APs and connected clients), and capture Wifi traffic. With all this information, the tool can create detailed maps showing coverage of each AP.

With the collected data, you can also use Acrylic Wifi heatmaps for troubleshooting. You can diagnose problems that affect your WLAN performance and health.
Key Features
- Adjust blueprints online
- Use GPS to browse larger extensions
- Generate 3D heat maps
- Active/Passive Wifi Survey with iPerf
- Real-time network status
- Generate advanced reports
- Export maps to GIS tools (Google Earth)
Why do we recommend it?
Acrylic Wi-Fi Heatmaps helps you identify your current Wi-Fi coverage and also plan out changes to an existing Wi-Fi plan. The service can also be used to help you to plan a new Wi-Fi implementation. You need to feed in a floor plan of your offices to get the heatmap drawn up on your real-world location.
Acrylic Wifi Heatmaps is also capable of generating customizable reports. The reports include wireless diagnostics and recommendations on how to improve the network.
Who is it recommended for?
This system is very expensive. However, Acrylic offers the system for a one-month subscription as well as selling perpetual licenses. That means you can just get the tool when you are planning a new office space or if you want to assess and fix your office’s Wifi coverage problems.
Pros:
- Designed for small to medium-sized businesses making it easy to use for less experienced users
- Automatically identifies best places for access point placement
- Drawing walls, rooms, and specifying building materials are easy
Cons:
- Lacks mobile app
- Not designed for enterprise use
Acrylic Wi-Fi Heatmaps comes in four different licensing methods. A one-month license ($145), three months license ($365), one year license ($990), and Perpetual license ($2480). Try the evaluation version of Acrylic Wi-Fi Heatmaps for 15 days.
3. NetSpot
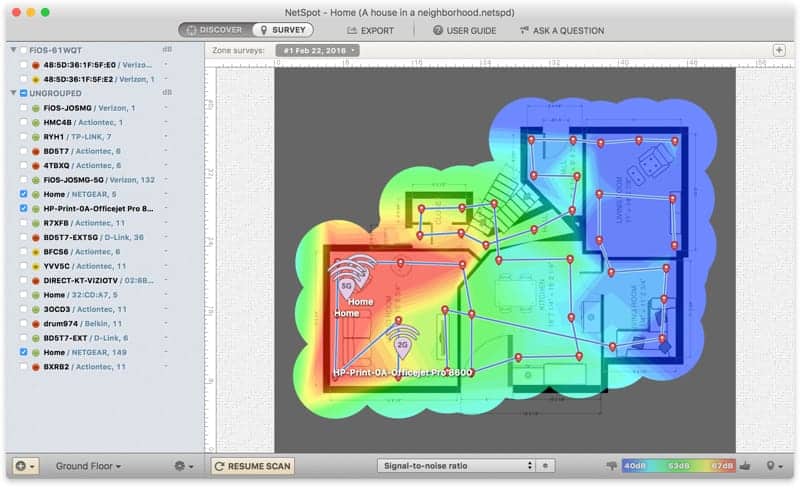
NetSpot is a comprehensive wireless site survey, Wifi analysis, and troubleshooting application. It is designed for a wide variety of scenarios, from small home WLAN users to large-scale wireless deployments. NetSpot can help you improve the wireless security standpoint by running an advanced analysis. It can also help optimize the Wifi signal strength via heatmaps.
Key Features
- A built-in mapping tool. If you don’t have an area layout, you can create one right there
- Automatic heatmap. Once you do a manual site survey, the tool will generate a heat map automatically
- Discover Mode. Automatically collects information about its surrounding Wifi networks
- Real-time Charts. It shows charts of signal level and noise in real time
Why do we recommend it?
NetSpot has a broad appeal because it can be installed on Windows, macOS, and Android. The ability to move around a space with a mobile device and record the actual signal in each location has a big advantage over systems that calculate footprint distance from known signal strength at the AP.
To start a site survey with NetSpot, you need to upload your office plan or area layout. Indicate your location on the office plan, and the tool will begin to calculate the wireless coverage. As you move around with your site survey device, Netspot will continue to record data of the signals received in the area, and finally, create a heatmap.
The heatmap will give you a visual representation of where the signal is strong and where it is weak. It will also help you to improve coverage, enhance wireless security, and avoid dead zones.
NetSpot is available for Windows and macOS.
Who is it recommended for?
This system is easy to install and set up – you will need to feed in a plan of your site. The free tool is very impressive and it can be good enough to plan good Wifi coverage for a small site. This system also provides a signal-to-noise ratio map.
Pros:
- A scalable tool that works well in both home offices as well as enterprise-sized networks
- Can run on multiple operating systems, supporting Windows and macOS
- Doesn’t require training to use, does a good job at being self-explanatory for new users
Cons:
- Lacks some device management features seen in competitor products
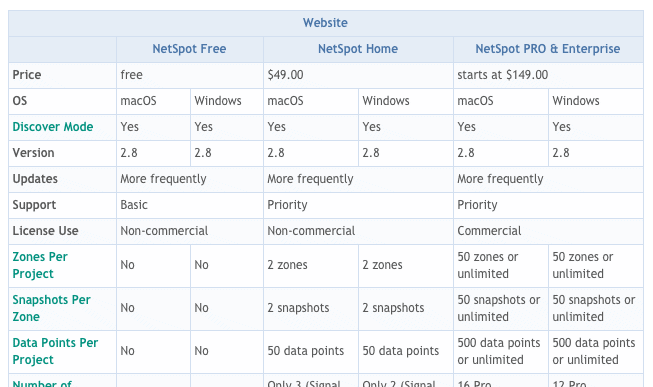
NetSpot has the following pricing versions – Free, Home ($49.00), PRO & Enterprise (starts at $149.00). NetSpot also offers two versions of the tool through the App Store with a difference in price and features. The Scanner ($7.99) and Reporter $39.99.
Download NetSpot free edition and start surveying your Wifi networks.
4. VisiWave Site Survey
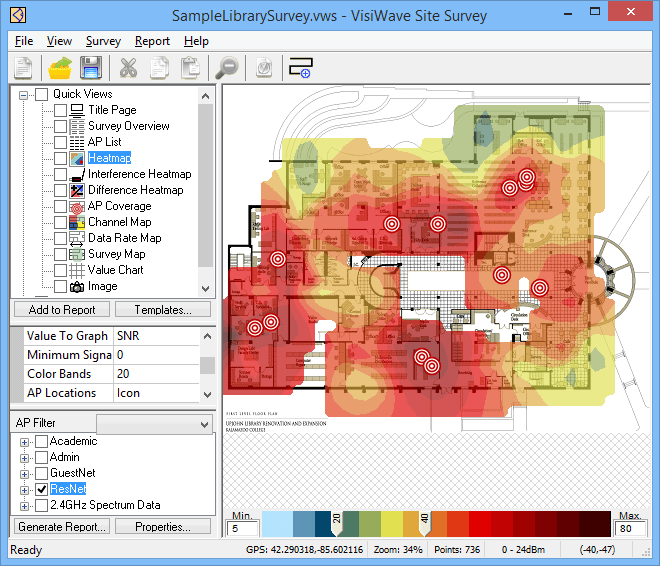
VisiWave Site Survey is an advanced WLAN site survey solution with data collection and visualization capabilities. It is designed for indoor/outdoor and metropolitan hotspots surveys. VisiWave allows you to analyze your WLAN, generate coverage heat maps automatically, and display radio waves.
Key Features
- A choice of signal statistics to depict
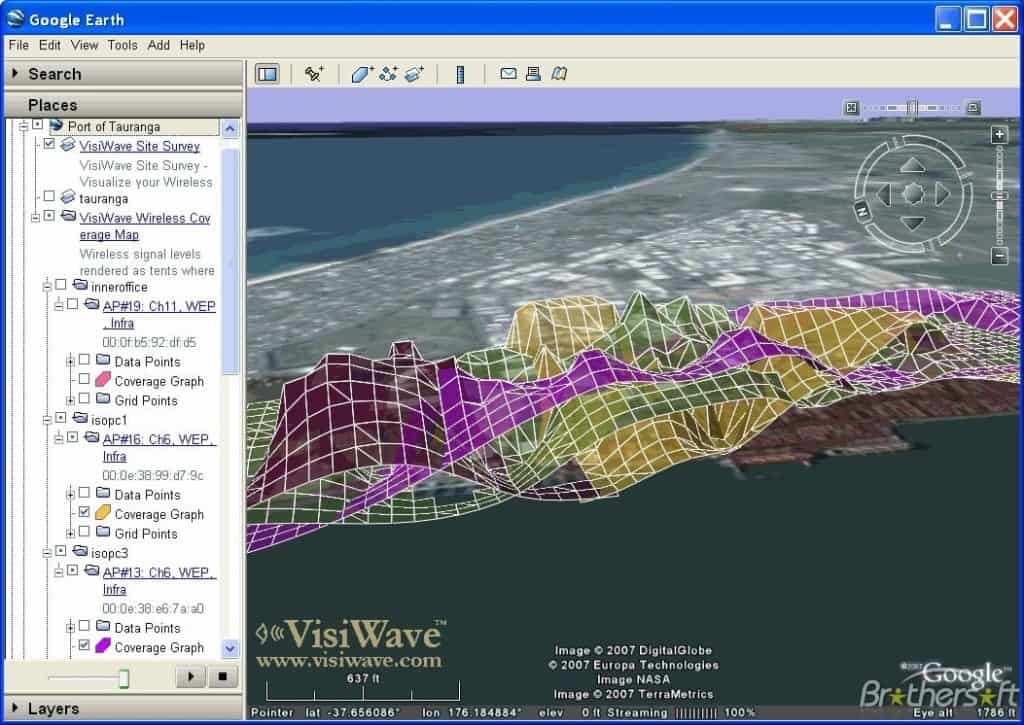
- An option to show signal footprints in 3D
- Indications of signal leakage
- Detection of rogue access points
- Documents channel usage
Why do we recommend it?
VisiWave Site Survey maps signal footprints for existing wireless networks and showed them in a color-coded heatmap. This system installs on a laptop that has built-in WiFi. you then walk around your space, recording location points. The tool builds up a heatmap from that collected data.
This tool is capable of scanning and collecting in-depth data from your WLAN and its surrounding networks. You can also troubleshoot problems related to wireless security, such as detecting rogue APs, or map signal leakage.
VisiWave Site Survey can also find and solve issues related to performance, such as identifying dead zones, view channel usage/overlaps, and more.
To start with a site survey, VisiWave provides three ways to capture data. You can either:
- Capture one point at a time.
- Roam around an entire survey area.
- Or use GPS positioning.
VisiWave Site Survey comes with a comprehensive reporting system. You can create customized reports, choose a report template, or visualize your generated heatmaps in Google Earth.
Who is it recommended for?
This is a good tool that you can run on your laptop. However, it doesn’t provide a version to run on a mobile device, so you have the inconvenience of walking around the office taking measurements with your laptop. Nevertheless, this is a respectable tool that provides easy-to-read heatmaps.
Pros:
- Offers a 3D visualization into wifi heat mapping
- Supports both GPS positioning and network card capture mapping
- Works well with other network mapping tools if needed
Cons:
- Must be used with other programs for continuous monitoring features
- Could provide a better free trial option rather than an evaluation version
VisiWave Site Survey comes in different shapes and sizes. The two most basic products and their prices are VisiWave Site Survey ($549.00) and VisiWave Site Survey Pro ($849.00).
Download the Evaluation version of VisiWave Site Survey for a limited time.
5. AirMagnet Survey PRO
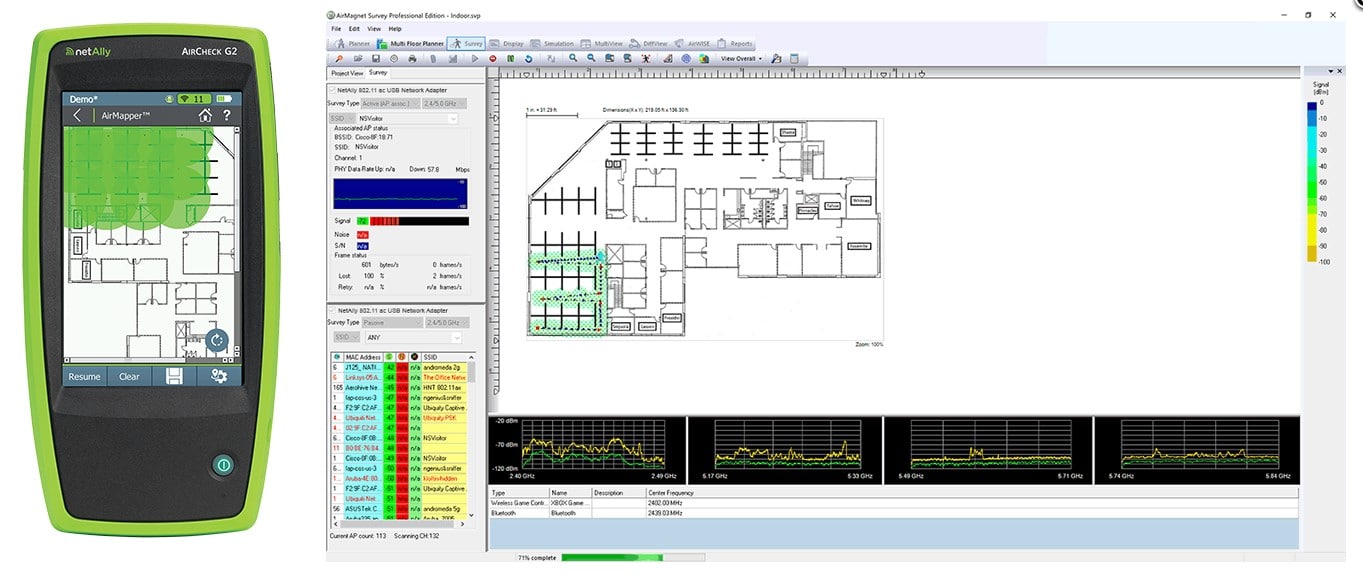
AirMagnet Survey PRO is a wireless site survey solution offered by NetAlly. The software is presented as a way to check on the NetAlly suite of Wifi Aps. However, it could just as well run on any network because it operates through the hosting device’s Wifi transceiver. It helps you by creating heatmaps so you can plan for capacity, design WLANs, and improve security.
Key Features
- Integrate with advanced spectrum analyzers
- Estimate budget with pre-deployment scenarios
- Conduct outdoor site surveys with GPS
- Perform Voice-over-Wifi site surveys
- Achieve end-user capacity planning
Why do we recommend it?
The AirMagnet Survey PRO analyzes data collected with physical survey devices produced by NetAlly. The survey system is sold in a bundle with AirMagnet Planner. While the Survey tool creates a heatmap of existing systems, the planner module lets you test the effects of changing the positions of current APS, upgrading them, or adding on more.
When doing a site survey, this tool goes beyond the traditional wireless scan. Aside from just analyzing signal coverage, AirMagnet Survey Pro can map out the user’s network performance, by gathering statistics related to bandwidth, network throughput, and packet loss. With this information, the tool can create a Wifi heatmap while displaying important end-user performance measurements.
AirMagnet Survey PRO can capture a large variety of survey data and generate heat maps.
It can build signal strength, noise, and SNR coverage heat maps. It can also create automatic maps related to channel interference, PHY data rates, packet retry, and more.
Who is it recommended for?
This is an expensive software bundle and even large organizations might think it is a big expense for something that will only be put to occasional use. Therefore, the tool is best suited for use by a consultancy, that will use the system on many sites during wireless network planning consultancy work.
Pros:
- Designed to support larger networks
- Features capacity planning tools, great for enterprise network administrators
- Templates allow admins to experiment with different power outputs and hardware configurations virtually
- Can calculate user network performance metrics in its simulations to help correlate the heatmap to potential downtime
Cons:
- Not available for Linux
- No free trial – must manually request a demo version
AirMagnet Survey wireless site survey software is available in “Express” and “PRO” versions. The price is not on the website, but you can get in contact with their sales team.
Final Thoughts & Conclusion
Optimizing Wifi networks can be challenging without the help of a Wifi heatmap. A visual representation of the signal strength can help you find dead zones, improve coverage, find signal leakage, and even track the location of mobile devices.
A heatmap is a crucial element when designing and building a WLAN. It will help you perform a proper site survey and plan for capacity.
Although the Wifi heatmap software comes at different sizes and prices, they all have the same basic functionality, to collect data and generate a heatmap. All the software showed in this list, have this ability and some others improve it with amazing features. Most of the software have free trial downloads, which is an excellent way to start testing your Wifi networks.
Wifi Heat Map Software FAQs
How do I create a heat map for Wi-Fi?
Typically, a heatmap includes a color-coded representation of the signal footprints on a site. This isn’t possible to do manually without extensive software development and there isn’t much point in creating your own Wifi heatmap tool when there are plenty already available off the shelf. So, the best way to create a Wifi heatmap is to buy a commercial heatmap tool and upload your location’s floorplan into it.
What is Wi-Fi heat mapping?
A Wifi heat map shows the signal coverage of wireless access points (APs). The display is color coded to easily recognize the signal strength of an AP in any location. Underlying the heat map should be a floor plan of the location.
How do you analyze a wireless network?
In order to analyze a wireless network, you need to install a signal analyzer on a server connected to your network. This will access all the wireless APs in your business and detail the channels in use plus provide measurements of traffic volume as it occurs.