We may earn a commission if you make a purchase through the links on our website.
The Best AIOps Platforms
UPDATED: March 10, 2025
AIOps platforms have one goal: To provide full AI capabilities for IT operations. Still, the market for AIOps platforms is tremendously diverse. Every product varies in capabilities, target, requirements, price, and even architecture. In this post, we’ll go through the best AIOps platforms in the market. Most of these products were born for slightly different purposes but all ended up turning into fantastic AIOps solutions that help bring AI into your operations.
Here is our list of the best AIOps platforms tools:
- ManageEngine Analytics Plus – EDITOR’S CHOICE An analysis package to support capacity planning, project management, security analysis, and financial controls, using machine learning and graphical data interpretations. Available as a SaaS package or for installation on Windows Server or Linux. Get a 30-day free trial.
- ManageEngine OpManager Plus – FREE TRIAL This large package includes all of the ManageEngine network and server monitoring and management tools and provides AIOps features. Runs on Windows Server and Linux. Download the 30-day free trial.
- Site24x7 – FREE TRIAL A leading AIOps platform, leveraging AI for predictive analysis and automated IT operations optimization. Start a 30-day free trial.
- Datadog A cloud-based infrastructure management and monitoring platform. Datadog allows you to build automated AIOps workflows.
- Dynatrace An all-in-one intelligent APM solution with AI-backed capabilities.
- Cisco AppDynamics An advanced APM and IT operations analytics solution for cloud and on-premise environments.
- Splunk Enterprise An end-to-end service monitoring platform with powerful analytics and automation.
- PagerDuty A SaaS-based incident response platform that collects telemetry data and provides alerts using ML and automation.
- Logic Monitor A SaaS-based APM, network monitoring, and AIOps platform powered by LM intelligence.
- Instana Enterprise Observability An observability and APM platform designed for managing microservices and cloud-native applications.
- Big Panda An advanced event correlation and automation platform powered by AIOps.
- MicroFocus OpsBridge An automated event correlation and analysis, and APM powered by AIOps.
- Moogsoft A cloud-native AIOps and observability platform.
- Zenoss Cloud A SaaS-based intelligent application and service monitoring and AIOps solution.
- New Relic One An advanced cloud-based full-stack observability platform.
Why AIOps Platforms?
The objective of AIOps platforms is to empower IT and operations professionals with the data they need to make faster decisions, keep applications up and running, resolve issues immediately, and even discover insights.
AIOps platforms attempt to eliminate data silos by integrating data from different sources in a central place. From here, AIOps platforms can leverage monitoring and observability capabilities to provide the necessary engagement, context, and automation.
Key Components in AIOps Platforms?
According to the Market Guide from Gartner, AIOps platforms center around two main components: IT Operational Big Data and Machine Learning (ML). They help collect a wide range of data, generated from different sources and automatically detect and react to situations in real-time. AI Ops platforms run collected data over ML and data analytics to automate and improve IT operations.
- Data Sources Data is key for AIOps platforms. These platforms help aggregate data (real-time or historical) to provide monitoring or observability capabilities. This data can range from metrics, logs, events, alerts, and more.
- Discover and Monitor The collected data from such sources is centralized and fed to the AIOps platform. The platform can monitor based on specific baselines and thresholds and detect anomalies.
- Provide Engagement and Context The AIOps platform can take collected monitoring or observability data and provide context (what, who, why, etc), recommended actions, insights, predictions, and alerts. Some AIOps platforms can also ingest engagement data (tickets, incidents, etc) to provide IT Service Management (ITSM) capabilities.
- Act and Automate Finally, AIOps platforms can combine collected data and run it through advanced analytics and ML. The results are automated outcomes for key IT functions, via scripts or run books.
The Best AIOps Platforms
The following AIOps platforms can use AI or Machine Learning to analyze large data volumes across different environments. They can improve the root cause analysis to proactively and reactively identify issues and provide a resolution.
Our methodology for selecting AIOps platforms
We reviewed various AlOps platforms and analyzed the options based on the following criteria:
- Integration support
- Effectiveness of AI and machine learning root cause analysis
- Facility to analyze performance over time
- Graphical interpretation of data, such as charts and graphs
- Free trial period, a demo, or a money-back guarantee for no-risk assessment
- Good price that reflects value for money when compared to the functions offered
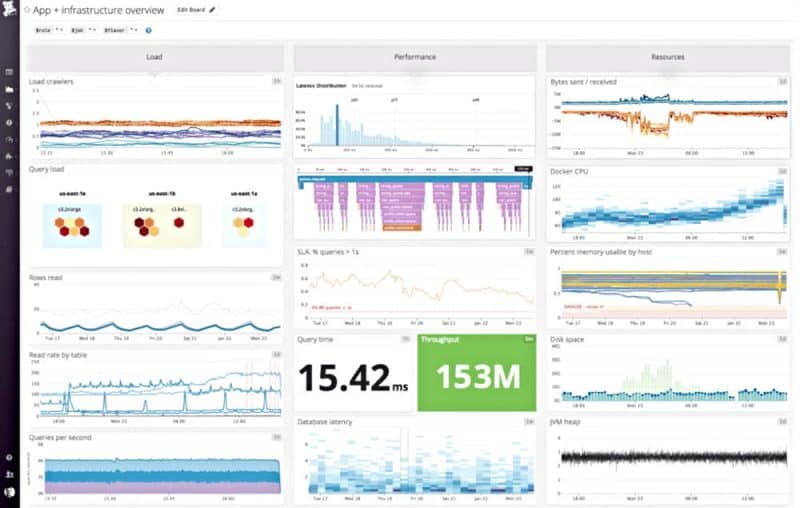
1. ManageEngine Analytics Plus – FREE TRIAL
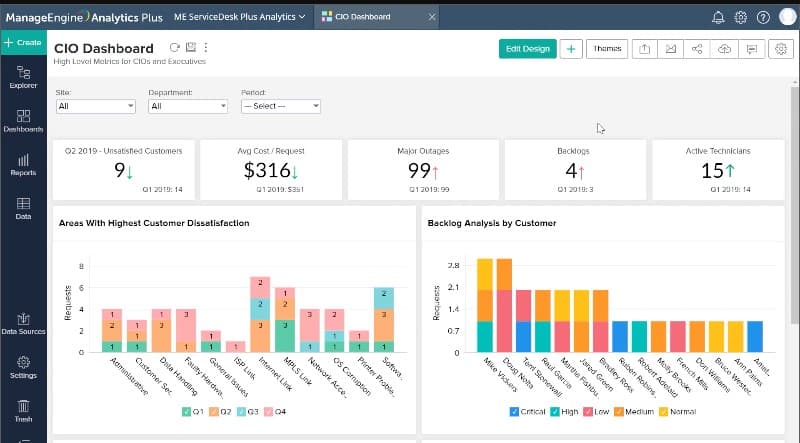
ManageEngine Analytics Plus provides an environment for operational analysis and development project tracking. The functions that this package supports include operations, finance, and security management. This is a good tool for protecting future requirements, thanks to the AI capabilities of the platform.
Key Features:
- AI-Powered Analytics and Reporting: Leverages machine-learning algorithms to identify trends, anomalies, and potential issues in IT performance data.
- Data Aggregation and Normalization: Ingests data from various IT infrastructure sources, including network devices, servers, applications, and security tools.
- Collaboration and Automation: Provides features for sharing reports and insights with stakeholders across the organization.
- Predictive Analytics: Using historical data and machine learning, Analytics Plus can predict potential performance issues before they occur, allowing for proactive maintenance and resource optimization.
Why Do We Recommend It?
While many AIOps tools emphasize IT operations metrics, Analytics Plus places a strong emphasis on translating IT data into actionable business insights. It helps bridge the gap between IT performance and its impact on business outcomes. Analytics Plus integrates seamlessly with other ManageEngine IT management products. This integration streamlines data collection, analysis, and reporting, creating a unified IT management experience.
This package scrapes existing systems for data once an hour. This means that it isn’t intended for use as a live monitoring service. Instead, you would use the system for identifying trends. For example, you could see whether costs are being kept within budget or are likely to escalate. You can also use the package to track compliance with data protection standards, including HIPAA and GDPR.
Who Is It Recommended For?
ManageEngine Analytics Plus is a valuable AIOps solution for organizations seeking a cost-effective platform that bridges the gap between IT operations and business value. It's ideal for SMBs, organizations focused on the business impact of IT, and those already using ManageEngine products.
Pros:
- Deployment Options: Offers both SaaS subscription and permanent license options for flexibility in deployment.
- Actionable Insights: Goes beyond data collection by translating data into actionable insights through reports, dashboards, and automated workflows, enabling informed decision-making.
- Cost-Effective AIOps Solution: Offers a centralized platform for various AIOps functionalities, potentially reducing licensing costs compared to multiple point solutions.
- Ease of Use: Boasts a user-friendly interface, simplifying data analysis and report generation even for users with limited technical expertise.
Cons:
- Data Source Dependence: The effectiveness of Analytics Plus relies on the quality and completeness of data ingested from various sources. Ensuring consistent and accurate data feeds is crucial.
Licensing: The SaaS platform uses a subscription model with a rate per month, starting at $199 per month. A perpetual license to run the software on Windows Server or Linux starts at $995. There is a Free edition available in both deployment options, which is limited to one user, managing five workspaces.
Assess either format of Analytics Plus with a 30-day free trial.
EDITOR'S CHOICE
ManageEngine Analytics Plus is our top pick for an AIOps platform because many departments will want to use this tool. Regular data pool updates mean that analysis can be performed on near-live data. It can provide assessments of existing activities for operations performance, delivery quality, user behavior, security events, and financial information. AI features provide projections to ensure that development projects and ongoing operations are sticking to budgets or are likely to go over that limit. Capacity analysis helps you save money by avoiding over-provision of resources and keeping ahead of demand where trends indicate more resources will be required.
Download: Get 30-day FREE TRIAL!
Official Site: https://www.manageengine.com/analytics-plus/
OS: SaaS, Windows Server, and Linux
2. ManageEngine OpManager Plus – FREE TRIAL
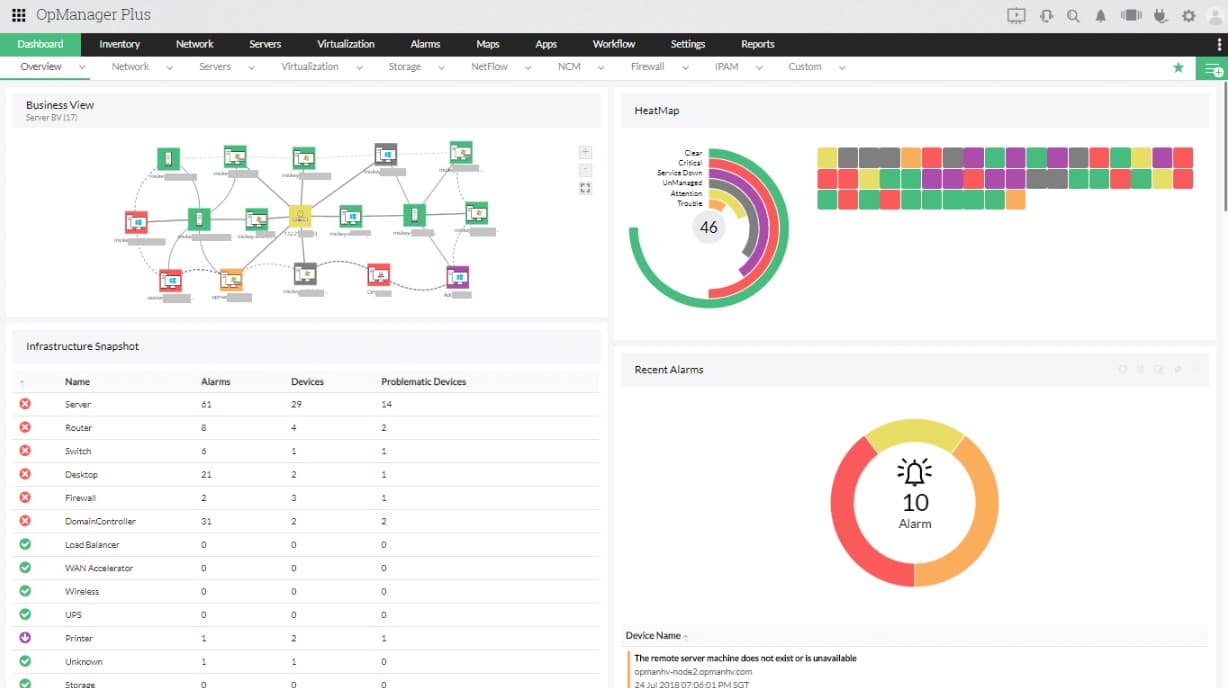
ManageEngine OpManager Plus is a bundle of ManageEngine network and server monitoring and management tools. Each unit in the package is also available individually. The pack provides all of the tools that an IT department needs to manage a system. All of the units in the bundle provide automated performance alerts and the thresholds for those alerts are continuously adjusted automatically by machine learning – an AI discipline.
Key Features:
- Unified Monitoring: Offers comprehensive monitoring capabilities for networks, servers, applications, databases, virtual machines, and cloud infrastructure from a single platform.
- Automated Remediation: Automates troubleshooting and remediation processes by implementing predefined workflows and automated actions in response to detected issues.
- Root Cause Analysis: Offers advanced root cause analysis capabilities to identify the underlying causes of performance issues and failures across the IT infrastructure.
- Predictive Analytics: Utilizes predictive analytics and machine learning algorithms to forecast potential IT issues, anticipate future performance trends, and recommend proactive measures to prevent downtime and optimize resource utilization.
Why Do We Recommend It?
We recommend OpManager Plus for its non-invasive traffic monitoring techniques, and its ability to automatically detect network faults and trigger pre-configured self-healing actions. This can involve automatic device reboots, route switching, or notifications to network administrators for faster issue resolution.
This is a full-stack monitoring package for on-premises systems. The correlation between units enables operators to see immediately the root cause of any emerging performance problem. Automated discovery features in the package include discovery and mapping for networks, virtualizations, and applications. This lets you track user-facing software to supporting services, server resources, and network delivery systems.
Who Is It Recommended For?
ManageEngine OpManager Plus is a compelling choice for organizations managing medium to large, complex networks.
Pros:
- Automation: Offers automation capabilities for routine tasks such as network discovery, configuration management, alert escalation, and report generation.
- Cost-Effective: Compared to purchasing and managing multiple monitoring tools, OpManager Plus can offer a more cost-effective solution, especially for organizations with limited budgets.
- Ease of Use: While some AIOps tools can be complex, OpManager Plus offers a user-friendly interface that simplifies configuration and management for network administrators.
Cons:
- Doesn't Cover Cloud Platforms: Lacks monitoring and management features specifically designed for cloud platforms, potentially limiting its utility for organizations heavily reliant on cloud infrastructure.
You can start with a 30-day free trial download
3. Site24x7
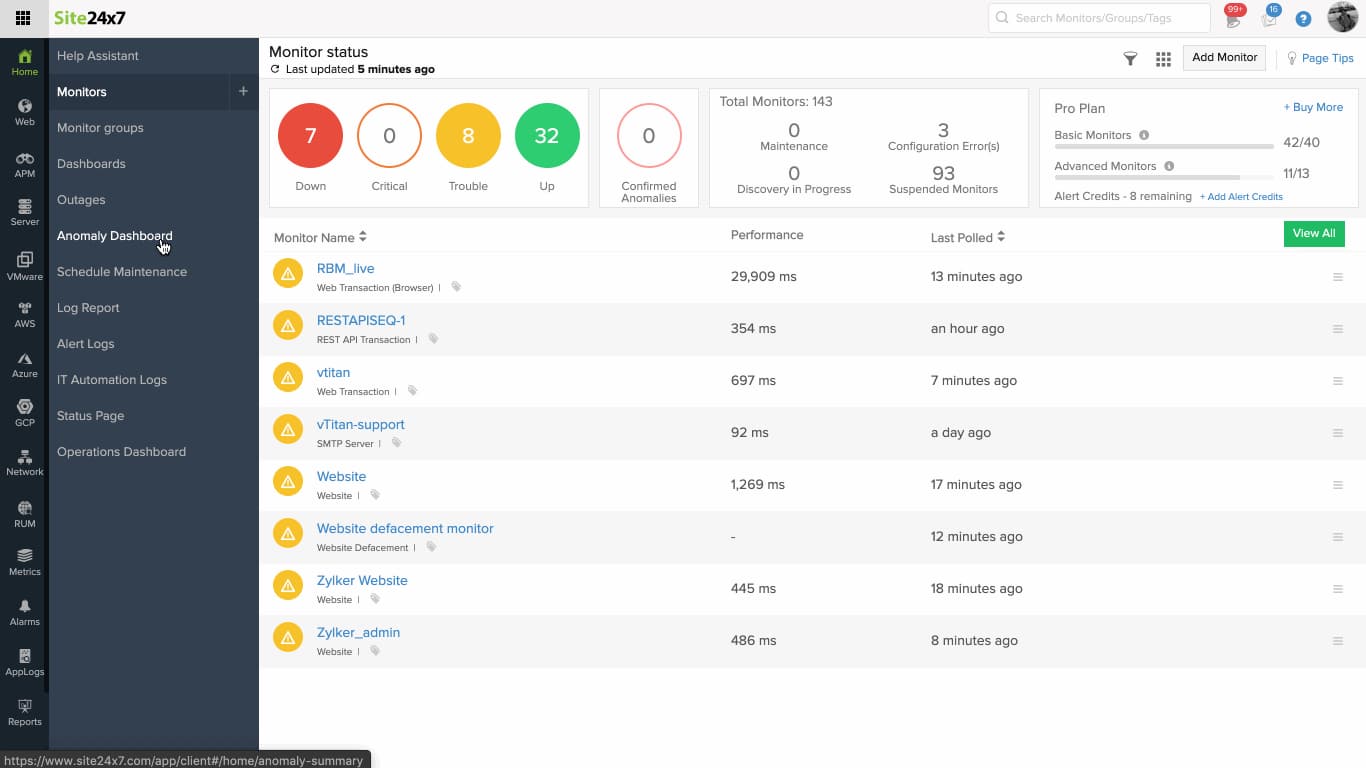
In the arena of AIOps Platforms, Site24x7 presents itself as a formidable contender, perfectly aligning with the needs of modern IT environments that demand intelligent, automated operations. This platform leverages artificial intelligence to enhance IT operations, making it capable of predictive analysis, anomaly detection, and automated remediation.
Key Features:
- Full-Stack Monitoring: Offers comprehensive monitoring capabilities across various IT infrastructure layers, including network devices, servers, applications, cloud workloads, and user experience.
- AI-Powered Anomaly Detection: Utilizes machine-learning algorithms to analyze monitoring data and detect anomalies in performance metrics.
- Performance Management and Alerting: Provides real-time performance monitoring with detailed insights into resource utilization, bandwidth usage, and application response times.
- Root Cause Analysis and Automation: Correlates alerts from various sources and leverage automation to perform basic troubleshooting steps, reducing manual intervention and expediting issue resolution.
Why Do We Recommend It?
We recommend Site24x7 for its built-in AIOps features, including anomaly detection, root cause analysis, and intelligent alerting. This empowers IT teams to proactively identify and troubleshoot issues, minimizing downtime and improving operational efficiency.
Site24x7’s strength lies in its ability to process large volumes of IT operational data, offering insights that help in proactive problem resolution and optimizing IT performance. Its intuitive interface and integration capabilities with various IT tools make it an essential asset for businesses looking to harness the power of AI in their IT operations.
Who Is It Recommended For?
Site24x7 is a valuable AIOps platform for businesses seeking a cost-effective solution with strong application performance monitoring, business context integration, and user-friendly automation capabilities.
Pros:
- Unified Monitoring Platform: Eliminates the need for multiple monitoring tools by offering a comprehensive solution for various IT infrastructure components.
- Proactive Problem Identification: AI-powered anomaly detection helps identify potential issues before they disrupt operations, enabling proactive maintenance and improved uptime.
- Scalability and Cost-Effectiveness: Scales to accommodate growing IT infrastructures and offers flexible pricing plans to suit different organizational needs.
Cons:
- Potential for Alert Overload: Extensive monitoring capabilities can generate a high volume of alerts. Proper configuration is crucial to avoid alert fatigue.
4. Datadog
Datadog is an advanced cloud-based infrastructure management and monitoring platform. It provides APM, log management, security, network, synthetic, and real-user monitoring. Datadog is fantastic for collecting and aggregating data (such as metrics, traces, or logs) from more than 400 different technologies, using lightweight agents.
Key Features:
- Automated AIOps Workflows: Enables building automated workflows using Webhooks integration and monitoring APIs.
- AIOps Integrations: Offers numerous integrations for AIOps, enhancing automation capabilities.
- Built-in ML: Utilizes built-in machine learning to simplify management and monitoring of growing environments.
- Alerts and Notifications: Provides alerts and notifications via email, PagerDuty, Slack, etc., for timely response.
Why Do We Recommend It?
Datadog leverages machine learning for proactive anomaly detection and intelligent alerting. It can identify unusual performance patterns and potential issues before they significantly impact operations.
With Datadog, you can keep track of a wide number of different resources, from network devices, containers, databases, servers, apps, cloud resources, and more. It can integrate with more than 250 built-in tools and services.
Who Is It Recommended For?
Datadog is recommended for businesses with diverse technologies (cloud, applications, microservices, etc.), businesses that generate significant log data from various sources, and businesses that requires detailed insights beyond basic metrics.
Pros:
- Holistic Network Monitoring: Monitors both internal and external aspects, providing network admins with a comprehensive view of performance and accessibility.
- Real-Time Root Cause Analysis: Provides real-time feedback and tools for root cause analysis, aiding in problem resolution.
- User-Friendly Interface: Excellent and easy-to-use interface for efficient monitoring and management.
- Flexible Pricing Options: Allows businesses to scale their monitoring efforts reliably through flexible pricing options.
Cons:
- Short Trial Period: Some users may prefer a longer trial period for thorough testing and evaluation of the platform's capabilities.
Datadog offers different plans (Infrastructure, APM, Log management, and more.) For more pricing information, check Datadog’s website. Get a free trial of Datadog for 14 days.
5. Dynatrace
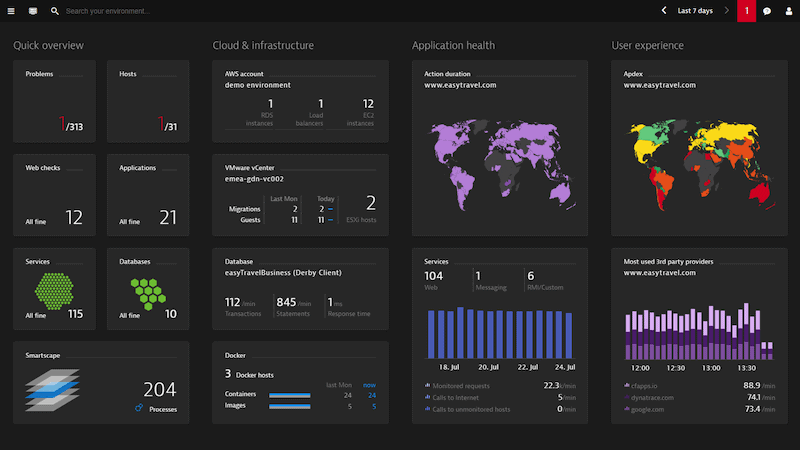
Dynatrace is an all-in-one intelligent application performance monitoring platform. It provides infrastructure and cloud monitoring, APM, digital experience monitoring, and automation. Dynatrace gives you AI-backed solutions for your entire IT ecosystem.
Key Features:
- Deep Application Monitoring: Goes beyond basic monitoring by offering deep code-level visibility into application performance.
- AIOPS Automation: Leverages AI and automation to diagnose and resolve IT issues automatically, identifying root causes, suggests solutions, and automates remediation actions.
- Digital Business Analytics: Extends beyond IT infrastructure monitoring and analyzes user behavior and business metrics. This allows for correlation between IT performance and business outcomes.
- Cloud-Native Monitoring: Built for the cloud and offers comprehensive monitoring for cloud-based applications and infrastructure.
Why Do We Recommend It?
We recommend Dynatrace for its advanced AI capabilities, auto-remediation capabilities powered by AI, and cloud-native platform, offering scalability, flexibility, and ease of deployment, especially within cloud environments.
Dynatrace uses Davis (an AI causation engine) and automation capabilities to provide answers about the performance of applications, underlying infrastructure, and the end-users “digital” experience. The platform provides insights and the “recommended” actions for follow-up.
Who Is It Recommended For?
Dynatrace is a suitable AIOps platform for organizations managing complex IT environments, prioritizing user experience, and seeking to understand the business value of IT.
Pros:
- Continuous Automation: Automates not just problem resolution but also routine tasks like configuration management and infrastructure provisioning.
- Advanced AI Technology: Leverages the latest AI technology for faster insights and efficient AlOps team operations.
- Visual and Customizable Dashboards: Offers highly visual and customizable dashboards, ideal for enterprise Network Operations Centers (NOCs).
- Cloud-Based Operation: Operates in the cloud, making it platform-independent and accessible from anywhere.
Cons:
- Designed for Large Networks: Tailored specifically for large networks, which may make the product overwhelming for smaller organizations with less complex infrastructures.
For more pricing information, get a quote. Register for a 15-day free trial of Dynatrace.
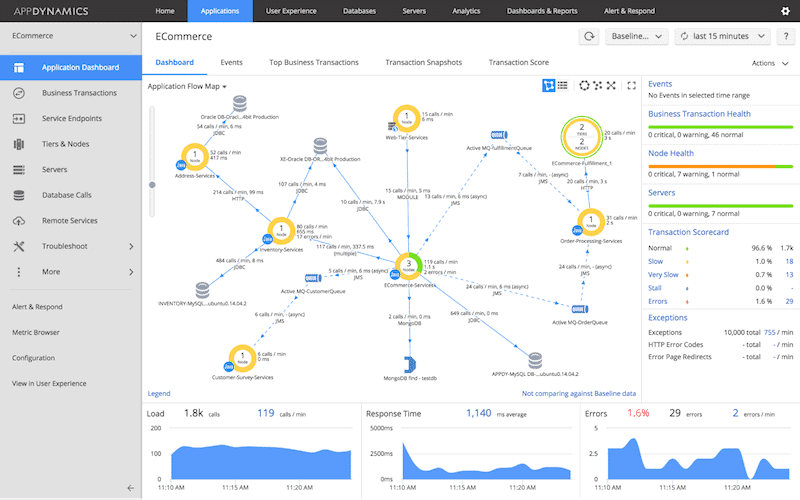
6. Cisco AppDynamics
Cisco AppDynamics is an APM and IT operations analytics solution for cloud-based and on-premise environments. AppDynamics was named for the 9th time, a leader in the Magic Quadrant for APMs.
Key Features:
- End-to-End Application Performance Monitoring: Offers comprehensive monitoring across the entire application lifecycle, from user experience to code-level analysis.
- Machine Learning and AI for Anomaly Detection: Leverages machine-learning algorithms to identify anomalies in application performance and predict potential issues proactively.
- Business Transaction Monitoring: Focuses on monitoring business transactions within applications, allowing for correlation between user actions and application performance.
- Automated Remediation: AI capabilities automate root cause analysis, pinpointing the source of problems within complex application environments.
Why Do We Recommend It?
We recommend Cisco AppDynamics for its comprehensive full-stack observability, integration of business performance monitoring, and advanced AI-driven insights. It differentiates itself with an application-centric approach, providing deep visibility into how IT issues affect business outcomes. The platform also offers robust anomaly detection, customizable scalability, and seamless integration with other tools, enhancing both IT operational efficiency and strategic decision making.
AppDynamics provides full-stack observability, including business health, user experience, application performance, infrastructure, network, and security— all in one unified dashboard. This platform is one of the few products that allows you to correlate full-stack performance data with key business metrics such as conversions.
Who Is It Recommended For?
Cisco AppDynamics is particularly recommended for medium to large enterprises that rely heavily on their digital services and applications for business operations. It is well-suited for organizations that require deep visibility into their IT environment to ensure high performance and availability of their applications.
Pros:
- AI-Powered Operations and Automation: Machine learning automates problem detection, root cause analysis, and even remediation, streamlining IT operations and reducing manual troubleshooting efforts.
- Cloud-Native Scalability: Scales efficiently to accommodate growing cloud deployments and application workloads.
- Integration with Cisco Ecosystem: Integrates seamlessly with other Cisco solutions, offering a unified view of application performance within the broader IT infrastructure.
- Free Version Available: Includes a free version, making it accessible for initial evaluation and small-scale deployments.
Cons:
- Cost: Known for its premium pricing model, which might be prohibitive for some organizations, particularly those with limited budgets.
Four editions are available: Infrastructure Monitoring, Premium, Enterprise, and Real-User Monitoring. The price starts at $6/month per CPU Core. Get a 15-day free AppDynamics trial.
7. Splunk Enterprise
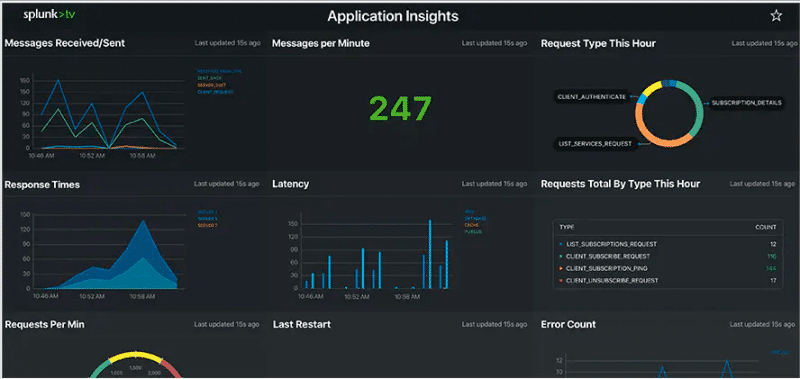
Splunk Enterprise is a machine data platform designed for data access, end-to-end service monitoring, powerful analytics, and automation. It provides full-stack visibility across cloud, on-premises, and hybrid infrastructure.
Key Features:
- Machine Learning for IT Operations: Leverages machine-learning algorithms to analyze vast amounts of IT data from diverse sources to identify anomalies, predicts potential issues, and automates tasks based on data insights.
- Event Correlation: Correlates events from various IT components like network devices, applications, and security tools to identify root causes of complex IT problems and expedite troubleshooting.
- Security and Compliance Management: Offers features for SIEM, enabling security log aggregation, analysis, and threat detection.
Why Do We Recommend It?
Splunk Enterprise is highly recommended as an AIOps platform due to its powerful data-processing capabilities and extensive adaptability across varied data sources. Unique in its ability to ingest and analyze large volumes of machine data in real time, Splunk provides actionable insights through advanced analytics and machine learning. This makes it an excellent tool for operational intelligence, allowing organizations to quickly identify, predict, and resolve issues.
Splunk lets you define data sources (websites, applications, sensors, etc), to automatically collect data from. Then it lets you search, analyze, and visualize this data. Next it indexes the stream of data and parses it with events data, to let you view and search, or get alerts. Additionally, Splunk provides data insights regardless of its source and format, and predictive and proactive insights (via AI/ML) to improve business decisions.
Who Is It Recommended For?
Splunk Enterprise is recommended for a broad range of organizations, particularly those that manage large volumes of data and require real-time analysis and operational intelligence. This includes enterprises in sectors such as finance, telecommunications, healthcare, and government, where quick data-driven decision-making is critical.
Pros:
- Data Agnostic and Scalable: Ingests and analyzes data from virtually any IT source, making it suitable for heterogeneous environments.
- Actionable Insights and Automation: Machine-learning and automation capabilities empower data-driven decision making and streamline IT operations by automating routine tasks and incident response procedures.
- Cross-Platform Support: Available for both Linux and Windows environments, offering flexibility in deployment.
Cons:
- Pricing Complexity: Requires contacting sales for pricing information, which may be seen as a drawback for some organizations.
Based on infrastructure and workloads. The pricing tiers are unlimited and predictive. Download a 60-day free trial of Splunk Enterprise.
8. PagerDuty
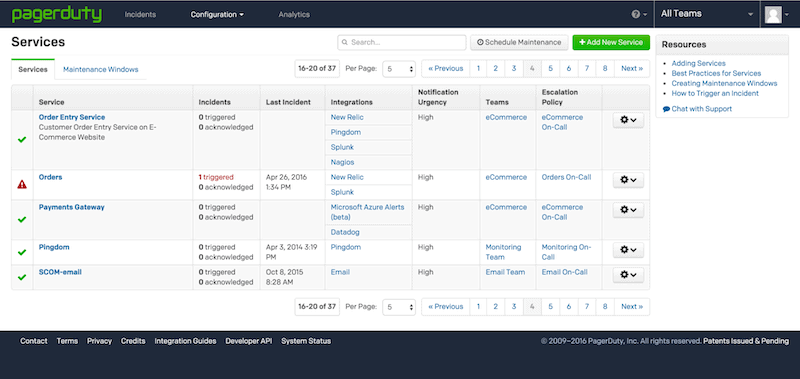
PagerDuty is a SaaS-based incident response platform designed to collect data, analyze it, and alert on outages and failures using ML and automation. It comes with built-in ML capabilities that help you configure rules based on AI and event intelligence.
Key Features:
- Automation and Workflows: Allows for automating routine tasks associated with incident response, such as notifying additional personnel, initiating self-healing actions, or integrating with remediation tools.
- Event Management and Alerting: Aggregates alerts from various IT monitoring tools and applications.
- Incident Collaboration and Resolution: Facilitates communication and collaboration among IT teams during incident resolution.
- Intelligent Dashboards: Offers insights and trends via Intelligent Dashboards for better team and service management.
Why Do We Recommend It?
We recommend PagerDuty for its exceptional incident response capabilities and its focus on real-time operations. What sets PagerDuty apart is its sophisticated alerting system that not only detects but also intelligently categorizes and prioritizes IT incidents based on their potential impact on business operations.
Additionally, the platform comes with a powerful alerting system. It can alert you of incidents via email, push, SMS, or phone. You can also set PagerDuty to automatically group alerts into single incidents using ML algorithms (enhanced by humans).
Who Is It Recommended For?
PagerDuty is particularly recommended for organizations that require robust incident response management to maintain continuous operations. This includes companies in industries like technology, finance, healthcare, and e-commerce, where uptime is critical and even minor disruptions can have significant financial or operational consequences. It's ideal for IT and DevOps teams who need to respond to and resolve incidents quickly to prevent or minimize downtime.
Pros:
- Reduced Alert Fatigue: By filtering, prioritizing, and routing alerts, PagerDuty cuts down on alert noise, ensuring IT staff focus on critical incidents.
- Enhanced Team Productivity: Efficient on-call management and automated tasks free up IT staff time for more strategic initiatives.
- Actionable Insights and Visibility: Analytics and reporting provide valuable insights into incident trends and team performance, enabling data-driven decision making for IT operations.
Cons:
- No Self-hosted Version: Lack of a self-hosted version may be a limitation for organizations requiring on-premise deployment for security or compliance reasons.
Four editions are available: Free ($0 up to 5 users/month), Professional ($19/user/month), Business ($39/user/month), and Digital Operations (Contact). Get a PagerDuty 14-day free trial.
9. LogicMonitor
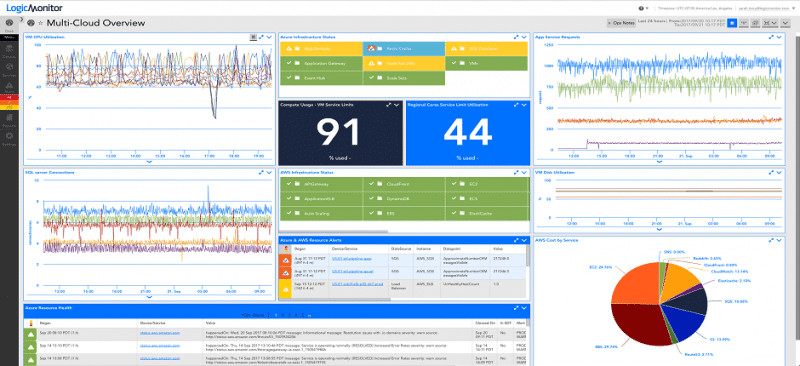
LogicMonitor is a SaaS-based APM and network monitoring solution. It comes with over 1000 pre-built automation monitoring and alerting mechanisms to help you keep track of applications and underlying infrastructure. It lets you monitor cloud, on-premises, and hybrid environments.
Key Features:
- Unified Monitoring Platform: Offers comprehensive monitoring capabilities across various IT infrastructure layers, including networks, servers, applications, cloud workloads, and IoT devices.
- Root Cause Analysis and Automation: Leverages automation to correlate events from various sources and pinpoint root causes of problems.
- Customizable Dashboards and Reporting: Users can create custom dashboards to visualize key IT metrics and generate reports tailored to specific needs.
- AI-Powered Anomaly Detection and Alerting: Utilizes machine learning to analyze monitoring data and detect anomalies in performance metrics.
Why Do We Recommend It?
LogicMonitor excels in automated discovery of IT resources, which ensures all components are continuously monitored without manual intervention. This automation extends to its deployment, which is quick and scales dynamically with the growth of an organization's IT environment. Its strong emphasis on providing actionable insights through predictive analytics and trend analysis helps organizations anticipate issues before they occur.
LogicMonitor provides an AIOps platform powered by AI and ML capabilities. LM Intelligence will analyze performance data and alerts, provide context, and early alerts, find patterns and anomalies, forecast, and enable automation. For example, if LM detects abnormal behavior it can automatically execute a custom script.
Who Is It Recommended For?
LogicMonitor is especially beneficial for mid-sized to large enterprises that manage extensive networks, cloud services, and server infrastructures across multiple locations. The platform's ability to automatically discover and monitor IT resources makes it ideal for companies that aim to reduce the manual overhead associated with IT operations.
Pros:
- Proactive Problem Identification and Resolution: AI-powered anomaly detection and automation capabilities enable proactive identification and resolution of IT issues, minimizing downtime and improving uptime.
- Scalability and Cost-Effectiveness: Scales efficiently to accommodate growing IT environments and offers flexible pricing plans to suit different organizational needs.
- User-Friendly Interface: Provides a user-friendly interface with customization options for dashboards, reports, and alerts, catering to diverse user preferences and requirements.
Cons:
- Short Trial Period: Trial period is only 14 days, which may not be sufficient for some users who prefer a longer testing period to evaluate the platform thoroughly.
LogicMonitor is available in two editions: Pro and Enterprise. For more information, request a quote. Sign up for a free 14-day trial of LogicMonitor.
10. Instana Enterprise Observability
IBM Instana is an enterprise observability and application performance monitoring platform. Instana is specially designed for managing microservices and cloud-native applications.
Key Features:
- Automated Discovery and Monitoring: Automatically discovers, monitors, performs root cause analysis, and provides feedback.
- Optimization Tools: Uses Dynamic Graph, Context Guide, and Unbounded Analytics to optimize performance and availability.
- Proactive Intelligence: Delivers actionable intelligence proactively.
Why Do We Recommend It?
What sets Instana apart is its ability to provide immediate, precise insights and full observability across the entire application stack, from the frontend to the backend, including infrastructure and network layers. This is achieved through its continuous discovery, automatic tracing of every request, and the use of artificial intelligence to pinpoint issues accurately and predict potential disruptions.
The Instana Enterprise Observability platform automatically collects performance data (metrics, logs, events, and dependencies) from the cloud, on-premise, microservices, containers, or hybrid environments. It provides AI-based root cause analysis and high cardinality analytics. Instana processes data and turns it into contextual and actionable data through automation.
Who Is It Recommended For?
Instana Enterprise Observability is particularly recommended for organizations that utilize modern, dynamic application architectures, such as microservices, containers, and cloud-native technologies. It is ideal for companies engaged in agile development and DevOps practices, where rapid deployment and continuous integration/continuous deployment (CI/CD) are common.
Pros:
- Microservices and Cloud App Monitoring: Ideal for monitoring microservices and cloud applications, providing detailed insights.
- Enterprise Focus: Designed with enterprise teams and operations in mind, catering to complex infrastructures.
- Wide Integration Support: Offers a wide variety of integrations and support, ensuring compatibility with various systems and services.
Cons:
- Cloud Service Reliance: Better suited for enterprise companies that heavily rely on cloud services, which may limit its utility for organizations with different infrastructure setups.
Instana pricing starts at $75 per host/per month/billed annually. Sign up for an Instana 14-day free trial.
11. Big Panda
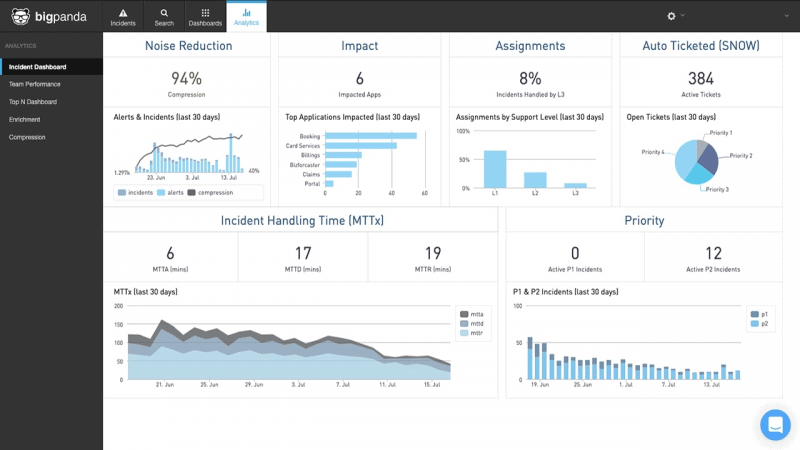
Big Panda is an advanced event correlation and automation platform powered by AIOps. It collects observability and monitoring data from tools and technologies, change data from change management, and topology data from sources such as orchestration. Big Panda integrates all this data into a single Open Hub.
Key Features:
- AI-Powered Alert Correlation: Machine-learning algorithms analyze incoming alerts, prioritize them based on severity and potential impact, and detect anomalies in IT performance data.
- Automation and Remediation: Offers capabilities to automate routine tasks associated with incident response, such as notifying teams, initiating self-healing actions, or integrating with remediation tools.
- On-Call Management: Simplifies on-call scheduling and ensures the right people are notified for incidents based on expertise and availability.
Why Do We Recommend It?
What makes BigPanda stand out is its Open Box Machine Learning technology, which allows users to see and adjust the machine-learning models according to their needs. This transparency helps in fine-tuning the system to better align with specific organizational processes and requirements.
Big Panda’s Open Box Machine Learning ingests aggregated alerts and event (monitoring) data and correlates it with topology data using ML heuristics. Additionally, Big Panda performs a root-cause analysis using change information, plus other processed data to identify anomalies. As a result, the platform can provide actionable insights and automation capabilities.
Who Is It Recommended For?
BigPanda is ideal for companies in industries such as telecommunications, finance, healthcare, and retail, where IT systems are critical and downtime can have significant repercussions. BigPanda's capabilities are well-suited for IT operations teams, network operations centers (NOCs), and DevOps teams that need to efficiently manage and reduce the noise from multiple monitoring tools
Pros:
- AI-Driven Data Management: Leverages AI to collect, interpret, and manage diverse data points, improving insights and decision-making.
- Workflow Automation: Uses automation to streamline workflows and enhance team intelligence, boosting efficiency.
- Faster Incident Resolution: Automated workflows, communication tools, and incident ownership assignment expedite incident resolution, leading to reduced downtime and business impact.
Cons:
- Trial vs. Demo: Some users may prefer a trial period to explore the platform's capabilities hands-on, rather than a demo which may not provide a comprehensive experience.
Register for a free demo.
12. MicroFocus OpsBridge
OpsBridge by MicroFocus is an automated event correlation, analysis, and performance monitoring platform powered by AIOps. It is designed for a wide range of environments, from multi-cloud, SaaS, on-premises, and hybrid IT.
Key Features:
- Topology-Based Event Correlation: Correlates events based on system topology for effective incident management.
- Anomaly Detection: Identifies anomalies in system behavior for proactive troubleshooting.
- Root Cause Analysis: Provides root cause analysis and visualization capabilities, enabling teams to identify and address issues effectively.
Why Do We Recommend It?
MicroFocus OpsBridge integrates various aspects of IT monitoring, including infrastructure, applications, and business services, into a single pane viewpoint. This integration allows for more effective oversight and faster response times to IT issues. Unlike other AIOps platforms, OpsBridge is particularly noted for its robust automation capabilities, which include automated remediation and proactive anomaly detection.
OpsBridge can collect and integrate monitoring (metrics, logs, events) data from more than 200 different technologies and tools. It discovers the topology to provide monitoring capabilities and event correlation to find the root cause of problems. Big Panda centralizes the data in a single pane of glass and provides ML and AIOps-based big data analytics.
Who Is It Recommended For?
Micro Focus OpsBridge is most suitable for large enterprises and organizations that have complex IT environments spanning multiple platforms, including cloud, on-premises, and hybrid setups. These organizations often face challenges in managing vast amounts of data and require robust tools to automate and streamline their IT operations management.
Pros:
- Excellent Dashboard: Provides an excellent dashboard and monitoring interface for easy visualization and management of operations.
- Extensive Data Collection: Leverages over 200 different tools for data collection, ensuring comprehensive monitoring.
- Single Pane View: Offers a single pane view into all AIOps operations, improving visibility and control.
Cons:
- Enterprise Suitability: Better suited for larger teams and enterprises with complex infrastructure and operational needs, which may make it less suitable for smaller organizations.
Download a free trial of Operations Bridge Manager (OBM), a core component of the Operations Bridge. OBM can automatically discover and correlate data.
13. Moogsoft
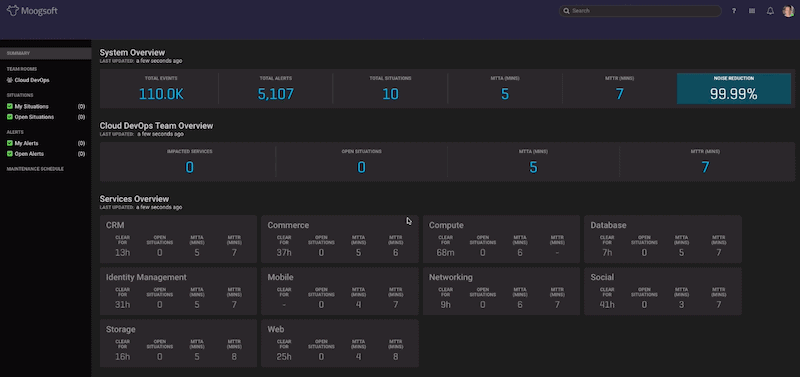
Moogsoft is an enterprise cloud-native AIOps and observability platform. It provides noise reduction, data enrichment, correlation, and anomaly detection. It delivers actionable service insights and alerts in real time.
Key Features:
- Real-Time Analysis: Provides real-time analysis using machine learning algorithms for efficient incident management.
- Early Incident and Anomaly Detection: Detects incidents and anomalies early, enabling proactive remediation.
- Customizable Integrations: Offers both customizable and out-of-the-box integrations for seamless workflow integration.
- Cross-Domain Collaboration: Facilitates collaboration across different domains for improved problem-solving.
Why Do We Recommend It?
What sets Moogsoft apart from other AIOps platforms is its sophisticated algorithmic noise reduction and correlation capabilities, which significantly reduce the number of alerts by filtering out irrelevant information and identifying the root causes of issues. This allows IT teams to focus more on resolving critical problems rather than sifting through numerous alerts.
Moogsoft takes metrics, events, and alert data, and automatically applies noise-reduction algorithms. It also provides methods (deduplication) for bringing context to data interdependencies. Cleaning and enriching data helps faster incident detection and resolution. Moogsoft also correlates data to identify patterns in apps and systems and ensure they are running at their highest performance.
Who Is It Recommended For?
Moogsoft is particularly well-suited for organizations that face frequent operational disruptions and need to quickly identify and resolve IT issues to minimize impact on business operations.
Pros:
- Enterprise-Focused: Built specifically for enterprise AIOps needs, ensuring scalability and robust functionality.
- Noise Reduction AI: Utilizes noise reduction AI to reduce alert fatigue and eliminate duplicate alerts, improving efficiency.
- Free Version Available: Supports a free version, making it accessible for initial evaluation and small-scale deployments.
Cons:
- Learning Curve: Given its robust feature set, it can take time for users to fully explore and utilize all of Moogsoft's capabilities effectively.
Three editions are available: Free, Team ($833/month), and Enterprise (contact). Request a free Team Moogsoft Trial express.
14. Zenoss Cloud
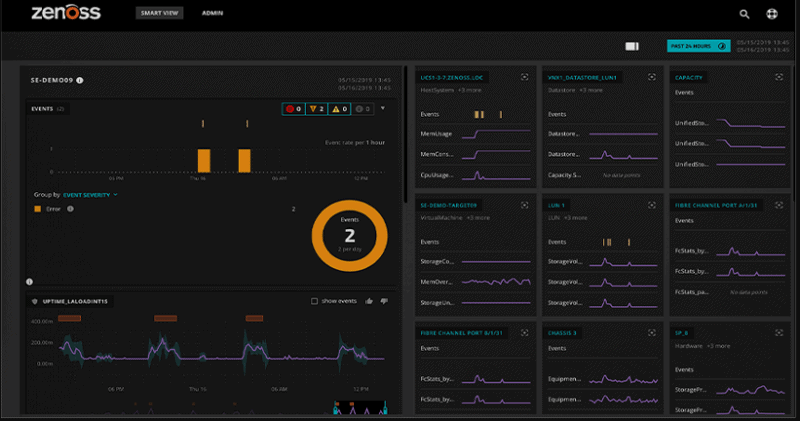
Zenoss Cloud is a SaaS-based intelligent application, service monitoring, and AIOps solution. It can provide full-stack monitoring capabilities for a wide range of IT environments, cloud, on-premise, hybrid, to dynamic multi-clouds.
Key Features:
- Unified Monitoring: Provides monitoring capabilities for hybrid IT environments, including physical infrastructure, virtualization platforms, cloud services, containers, and applications.
- Intelligent Alerting: Uses machine-learning algorithms to analyze monitoring data and generate intelligent alerts, reducing noise and alert fatigue by prioritizing critical issues and correlating related events for faster incident resolution.
- Automated Remediation: Offers automated remediation workflows and self-healing capabilities to resolve common IT problems automatically, minimizing downtime, reducing manual intervention, and improving overall operational efficiency.
Why Do We Recommend It?
Zenoss Cloud is an excellent AIOps platform choice due to its strong emphasis on full-stack monitoring and deep analytics capabilities. What differentiates Zenoss Cloud from other AIOps platforms is its model-driven approach to IT monitoring, which helps maintain a real-time, comprehensive view of all IT assets, including physical, virtual, and cloud environments.
The Zenoss Intelligent IT Operations Management Platform can collect and analyze data, including metrics (push/pull), events, logs, dependency data, and streaming data, across different IT environments. Zenoss streams and normalizes all machine-generated data, using dynamic ML-based analytics in real-time.
Who Is It Recommended For?
Zenoss Cloud is well-suited for businesses that require a holistic view of their IT operations to manage and mitigate potential issues effectively before they impact service delivery. Zenoss Cloud's capabilities are especially beneficial for industries like telecommunications, healthcare, financial services, and technology, where high availability and reliability are critical.
Pros:
- User-Friendly Interface: Boasts a user-friendly interface with customization options for dashboards, reports, and alerts, catering to diverse user preferences and requirements.
- Open-Source and Free: Offers an open-source version that is completely free, with options for paid tiers.
- Automatic Network Discovery: Uses network discovery to automatically detect and pull in new devices on the network.
Cons:
- Support Limited to Paid Tiers: Support and additional features are only available for users subscribed to paid tiers, which may limit access to certain functionalities for free users.
Zenoss Community Edition is a free and open-source application. The Zenoss Cloud is available in two commercial editions: Professional and Enterprise. For more information request a quote. Register to try Zenoss Cloud for free.
15. New Relic One
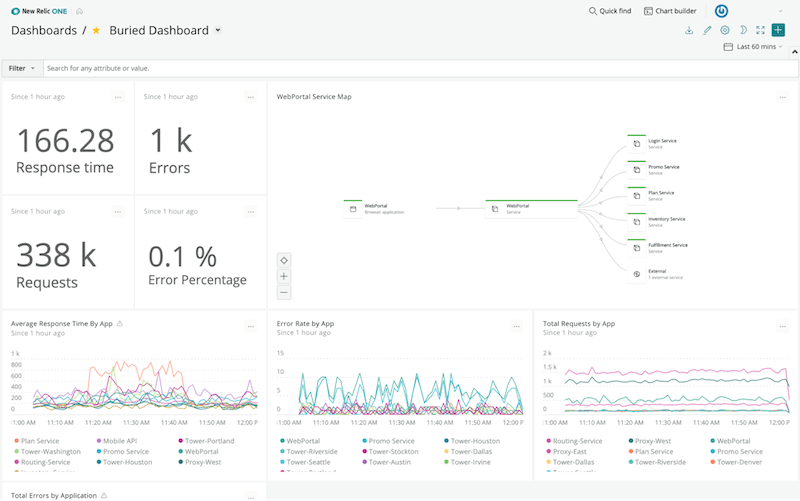
New Relic One is an advanced cloud-based observability platform. It allows full-stack observability for easy visualization, troubleshooting, and optimization of your entire software stack from a single place. It can help you keep track of your distributed services or applications regardless of where they are deployed.
Key Features:
- Instant Anomaly Detection: Detects anomalies instantly for proactive issue resolution.
- Automatic Event and Alert Correlation: Automatically correlates events and alerts for streamlined incident management.
- Integration with Incident Management: Integrates seamlessly with incident management tools for efficient incident response.
Why Do We Recommend It?
New Relic One focuses on delivering detailed performance insights and developer-centric tools that help teams proactively manage software health and optimize performance. This platform integrates seamlessly with DevOps workflows, enhancing deployment speeds and operational efficiency.
New Relic One also comes with a Telemetry Data Platform that provides a connected, real-time, and centralized view of all your operational data. This platform provides analysis and alerts on all metrics, events, logs, traces, etc. The New Relic One software also uses “Applied Intelligence” to help detect issues faster and understand what caused the issue and why.
Who Is It Recommended For?
New Relic One is particularly recommended for development teams and organizations that are heavily invested in creating and maintaining software applications, including those operating in cloud, on-premises, or hybrid environments. It is well-suited for businesses that prioritize continuous integration and delivery and require deep insights into application performance and user interactions to optimize user experience and software reliability.
Pros:
- ML-Based Root Cause Analysis: Utilizes machine learning for automatic root cause analysis, improving problem-solving.
- Certified for Microsoft Azure Monitoring: Certified for monitoring Microsoft Azure environments, ensuring compatibility and reliability.
- Intuitive Admin Dashboards: Features simple yet intuitive admin dashboards for easy monitoring and management.
Cons:
- Suitability for Azure Networks: While certified for Azure monitoring, New Relic One may be better suited for small to medium-sized Azure networks, potentially lacking some advanced features required for larger enterprises.
Telemetry Data Platform ($0.25 per GB ingested beyond the free limit). Full-Stack Observability: Standard (One full-access user free- $99 per additional user/month), Pro, and Enterprise. For more details, check pricing. Sign up for New Relic to get a fully functional free trial.
Conclusion
All the AIOps platforms shown in this post use AI or Machine Learning to analyze large volumes of data. They can monitor (some provide observability) and analyze data collected from different types of systems and infrastructures. These platforms can also help identify (proactively or reactively) issues and even help in the resolution process.
Fortunately, all of the above AIOps platforms are quite comprehensive, easy to learn, and all provide a free trial. To get yourself started, try platforms like ManageEngine Analytics Plus, Datadog, Dynatrace, or Cisco AppDynamics.
AIOps Platforms FAQs
What is an AIOps platform?
An AIOps (Artificial Intelligence for IT Operations) platform is a technology platform that combines artificial intelligence, machine learning, and big data analytics to automate and optimize IT operations processes and workflows.
What are the benefits of using an AIOps platform?
The benefits of using an AIOps platform include improved IT operational efficiency, faster incident resolution, reduced downtime, enhanced security, and improved customer satisfaction.
What are the features of an AIOps platform?
The features of an AIOps platform include data ingestion, data analysis, anomaly detection, root cause analysis, event correlation, alerting and notifications, automation, and collaboration.
What are the types of data sources that an AIOps platform can ingest?
An AIOps platform can ingest data from a variety of sources, including log files, metrics, traces, configuration data, and user data.
What is event correlation in an AIOps platform?
Event correlation is the process of analyzing and connecting events from different sources to identify patterns and relationships. An AIOps platform can use machine learning and big data analytics to correlate events and provide contextual information to IT teams.