We may earn a commission if you make a purchase through the links on our website.
Zabbix vs Datadog

UPDATED: October 13, 2022
Technology has seeped into the organizational framework so much that the extent is just beyond our imagination. Technically speaking, all that you interact with over the internet requires technological aspects on the companies' part. The company uses IT infrastructure to keep up with technological advancements and maintain its operations. Therefore, it is common to face IT infrastructural issues at some point in life. In simple terms, infrastructural problems are inevitable. To avoid such issues while working with technology, teams must have the best monitoring tools at hand to reduce the impact of an incident. Do you have any idea about monitoring tools? If no, then fret not! In this blog post, we will cover two great monitoring tools- Zabbix and Datadog so that you can streamline the disturbance caused by infrastructural issues as and when they arise.
Before jumping directly to these two tools, let us first understand the meaning and purpose of monitoring tools.
What are Monitoring tools?
Monitoring tools are the tools used to keep a continuous track of the system status. These tools help companies get the earliest warnings of failures, defects, and problems. They highlight these problems so that they get solved at the right time. Do you know what all infrastructural problems a monitoring tool can help you solve? If you answered ‘no', then don't worry! Think about all that you deal with while working. It's the servers, website, network, databases, security, performance, internet usage, and applications. You must be aware of all these as a tech expert. Monitoring tools help solve all aspects mentioned above by identifying the issue and sending an alert message to the network administrator. It also finds optimal settings and monitors the network traffic and the number of users on a network.
Now, let us understand what do Zabbix and Datadog do to help solve these infrastructural issues.
What do Zabbix and Datadog do?
Zabbix and Datadog are monitoring tools that detect issues in various IT components such as servers, databases, and applications and help solve them as and when they arise. In addition, they provide metrics such as network utilization to remove all the flaws in the IT aspect of the organization. All in all, they both perform the same role: solving issues with the IT components.
A customer understands a product with the product highlights. So, let us delve deeper and learn the product highlights of each of these products one by one.
Zabbix Product Highlights

Zabbix is an open-source monitoring tool for various IT components, including networks, servers, virtual machines (VMs), and cloud services. It uses several monitoring metrics, such as network utilization, CPU load, and disk space consumption to solve issues with the IT components. The Zabbix software majorly runs on Linux, Hewlett Packard Unix (HP-UX), Mac OS X, Solaris, and other operating systems. Zabbix supports both- agent-based and agentless monitoring. Agentless monitoring is pretty simple, but the process gets a little complicated when agent monitoring comes into the picture. To use Zabbix for agent-based tracking, the first step is installing agents on the IT components. Then, one needs to install agents to check and collect data about a particular IT component. This agent reports back to a centralized Zabbix management server to collect information. The collected data is then presented with the help of graphical charts using the Zabbix GUI (Graphical User Interface). Zabbix also sends a notification if any issue arises with the monitoring process. On the other hand, agentless monitoring achieves the same results but with the help of the existing resources of a system.
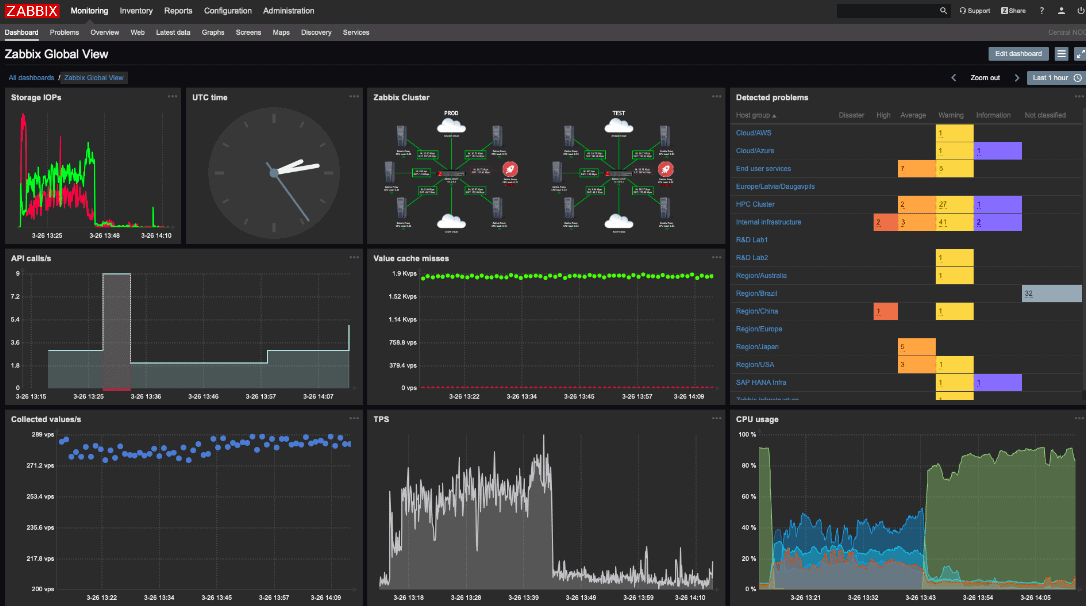
Zabbix allows users to check their IT surroundings with the help of its web-based GUI (Graphical user interface). It shows a variety of widgets, graphs, network maps, slideshows, and reports on the customizable dashboard for this purpose. Additionally, Zabbix works with three discovery mode options: Network discovery, low-level discovery, and Autodiscovery. Network discovery. These make it remotely run scripts, collect data from multiple sources and combine that data in a single customizable dashboard.
Key Features of Zabbix
- Real-time graphing – IT components can be monitored and graphed instantly using the built-in graphing functionality. The graphing user interface helps one monitor all the IT and technological aspects in a simple and hassle-free manner.
- Web monitoring capabilities – It can follow a simulated path of web clicks for functionality and response time.
- Highly configurable alerting – Zabbix sends notifications customizable for escalation schedule, recipient, and media type. It also alerts on a real-time basis to solve the underlying IT problem as soon as possible.
- Zabbix API offers a programming interface for mass manipulations, 3rd party software integration, and other purposes.
Pros:
- Open-source transparent tool
- Uses both SNMP and ICMP for a broader monitoring range
- Can detect new devices and configuration changes immediately
- Offers useful templates for quick insights
- Robust notification system supports SMS, email, custom script, and webhook
Cons:
- The interface isn’t as intuitive as solutions such as DataDog or Site24x7
- Would like to see better-alerting features, specifically related to reducing false positives
Datadog Product Highlights

Datadog is a data observability software for cloud-scale applications that provides monitoring services for databases and servers through a SaaS-based data analytics platform. The Datadog provides all the developers and IT operations team a single-stop solution to monitor all the IT components with a visual interface. With a single interface, businesses can analyze key network metrics and reduce application deployment cycles.
It also allows administrators to create complex alerting triggers that give more actionable alerts and false-positive notifications. It is a well-known fact that notifications are usually sent via email. However, with Datadog, there are other alternatives. Datadog can be integrated with other high alerting systems such as OnPage to send alert notifications. A standard Datadog package operates on Amazon Linux, CentOS, Debian, Fedora, Red Hat, SUSE, and Ubuntu. The standard package is used in containerized environments too.
Key Features of Datadog
- Alerts – Datadog users help companies create custom alerts for any metric or performance problem. Notifications can be received via multiple platforms such as email, Slack, PagerDuty, etc.
- Advanced integration – Datadog can integrate with various products and development stacks to conclude metrics and events. The integrations include automation tools, monitoring, instrumentation, source control, and standard teams server components.
- Dashboard – Datadog has an interactive dashboard that helps organizations track, monitor, and graph real-time metrics and events.
- Collaboration – Datadog enables interfirm collaboration across various teams. It also helps users keep a record of historical problems and communication.
Pros:
- Offers numerous real user monitors via templates and widgets
- Can monitor both internally and externally giving network admins a holistic view of network performance and accessibility
- Changes made to the network are reflected in near real-time
- Allows businesses to scale their monitoring efforts reliably through flexible pricing options
Cons:
- Would like to see a longer trial period for testing
By now, you must have understood that both monitoring software provides similar services and perform the same role. So, where does the difference lie? Why should one choose one over the other? Let's find the answer to these questions with the help of a feature comparison table.
Feature Comparison Table: Zabbix Vs Datadog
| Basis | Zabbix | Datadog |
|---|---|---|
| Top features | Bandwidth monitoring, network analysis, network resource management, web traffic reporting | Dashboard, server monitoring, web traffic reporting, uptime reporting |
| Pricing | $1600 per year (subscription-based) | $15 per month (subscription-based) |
| Best for | Freelancers, small businesses, and mid-sized companies | Developers, IT operations teams, freelance engineers, and business users in the cloud age |
| Integrations | GitHub, Jira, Microsoft 365, and Microsoft Azure | Datadog, PagerDuty, and Opsgenie |
| Platforms supported | Web-based, iPhone, and Android | Web-based |
Zabbix vs Datadog Head-to-Head
User Interface
Datadog has a straightforward and clean user interface. Everything is crystal clear after few usages. It is effective enough to help users get work done faster and in a hassle-free manner. But there is still room for improvement. For example, the Datadog user interface could be improved in looking for host information and installation of agents. On the other hand, Zabbix's user graphical user interface is intuitive and very user-friendly. It provides an in-depth view of the problem with various metrics such as auto-discovery, advanced problem detection, intelligent alerting & remediation, automated collection of metrics, and distributed monitoring.
Monitoring capabilities
Zabbix has good monitoring capabilities. It follows a path of simulated mouse clicks on a website to check functionality and response time. While on the other hand, Datadog offers no less than a good set of monitoring capabilities to its customers. It provides a better view of all operations and accesses performances about all the internal DNS queries, transactions, and managed services in a single view. It also helps customers detect poor internal DNS resolution and application issues on a real-time basis.
Installation
Zabbix has three significant components: Zabbix Server, Zabbix Agent, and Zabbix Web Interface. You need to install the Zabbix server and Zabbix agent for monitoring purposes. The monitoring of Zabbix agents through Zabbix servers is still the same; however, installing the Zabbix interface enhances the overall experience to a different level. To download the Zabbix, you first need to create a LAMP environment and Configure Zabbix Package Repository. After that, you need to Install Zabbix Server, create a database Schema and edit the Zabbix configuration file. Lastly, restart Apache and Zabbix and finish the installation. To download the Zabbix agent, you first need to enable the apt repository. Then you have to install and configure and restart the Zabbix agent.
As far as Datadog is concerned, the process is somewhat similar. You need to first install the agent on a host or a containerized version. Secondly, you would have to configure, validate and restart your agent. In short, the installation process of Datadog is a little more straightforward.
Reports
Reporting is another area where Datadog delivers a great experience to customers. Datadog allows you to schedule reports to be mailed at regular intervals. You can pick any of the existing dashboards. Adding the URL to the report to a reporter web application and setting mailing intervals will effortlessly mail you the report attachment. Zabbix, on the other hand, offers excellent reporting too. The reports menu features several sections that contain a plethora of predefined and user-customizable reports that display an overview of such parameters as system information, triggers, and gathered data. Zabbix turns out to be slightly better in this regard.
OS support
Zabbix supports various operating systems such as AIX, FreeBSD, HP-UX, Linux., Mac OS /X, NetBSD, OpenBSD, SCO Open Server. On the other hand, Datadog also supports multiple operating systems such as Amazon Linux, CentOS, Debian, Fedora, Red Hat, SUSE, and Ubuntu. However, to use the Zabbix software on Windows, you need to install an agent.
Support
Both these platforms offer excellent support services to the customers. However, Datadog wins this aspect with its 24/7 email, portal, phone services, and video tutorials. It also offers many communities and forums where one can discuss problems related to the Datadog software. In short, the diversity of support systems gives Datadog an edge over Zabbix.
Training
When assessing the two solutions, it was found out that Datadog excels over here as well. Datadog is relatively easier to set up and use. It doesn't leave you scratching your head because of its easy-to-learn and straightforward application. Additionally, you can quickly learn how to use Datadog with a dedicated practice of months. Yes, this is all that you need to master this monitoring software. While Zabbix is great to work with, but requires more much more training and effort. It's a bit hard to get a direction for those who have just started using Zabbix for monitoring purposes.
Pricing
Well, in respect of cost, both Zabbix and Datadog are doing massively well with their free trial policy. They offer a subscription-based model. Zabbix offers a yearly subscription for $1500/year, and Datadog provides a monthly subscription of $15 to customers. It is seen that businesses prefer Datadog more as it helps them test the fantastic features at a monthly subscription cost. This makes Datadog much preferable and affordable in comparison to Zabbix.
Zabbix vs. Datadog: TheVerdict
Overall, both Zabbix and Datadog are excellent tools for keeping up with your systems, infrastructures, and workflows with constant and ceaseless monitoring. They are an easy way to keep up with stellar performances while instantly fixing any problems that arise at any point. But still, see that Datadog is much more in demand because of its competitive monthly subscription model and seamless support and reporting system. Not only this but, it is impressive in terms of monitoring capabilities too. But, on the other hand, if you're someone who looks for better reporting, then Zabbix might be the best software for you!