We may earn a commission if you make a purchase through the links on our website.
What is a Continuous Profiler?
UPDATED: February 26, 2024
When application issues and bottlenecks arise in production (as is often the case), developers need to investigate and carry out root cause analysis quickly to identify the underlying problems and prevent a re-occurrence. Unfortunately, to do this, they often depend on data logs and code instrumentations – a relatively time-consuming, less informative, traditional, and retrogressive approach.
However, there is a more modern and advanced approach. With profiling tools and techniques, developers can identify the slowest application code. Continuous profiling reveals the code consuming the most resources on an ongoing basis and in any environment.
This article provides an overview of continuous profiling, its concepts, and its advantages. In the last section, we also highlight the best profiling tools.
With thorough research, we have listed below the top profiling tools to enhance your code performance:
- Datadog Continuous Profiler This tool helps you optimize unnecessary resources and code to improve user experience and MTTR. It works by identifying line by line without affecting the entire code and prevents cloud provider costs.
- New Relic Thread Profiler This tool is the one-stop destination for monitoring needs. It helps to analyze and debug the threats and other issues over the network to improve productivity.
- Google Cloud Profiler It is basically an integrated and trace-managed service that involves collecting user information to understand the weak areas and offer better service.
- Amazon CodeGuru It is a static application security testing tool that makes use of machine learning automation to detect issues in the code and real-time behavior of the apps.
What is Continuous Profiler?
A continuous profiler is a powerful technique that continuously collects line-level profiling performance data from any environment (including production). Then it provides the data visualizations so that developers can analyze, troubleshoot and optimize their code.
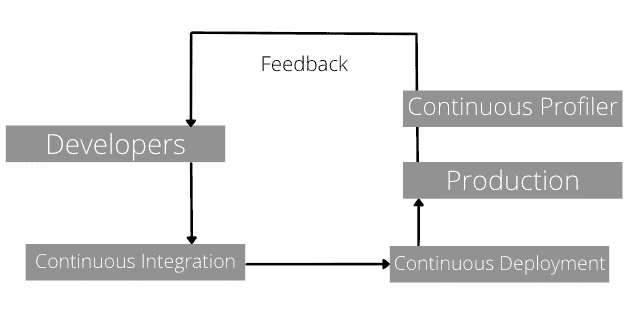
Developers can implement continuous integration and deployment for the production environment. The production then feeds back to the continuous profiler, a feedback loop that provides profiled data comebacks to the developers. Refer to the diagram below.
What is not a continuous profiler?
Continuous profiler is the opposite of Ad Hoc production profiling. In the latter, a profiler is only linked to a production environment when the need arises. However, continuous profiling is better and more advantageous than the two techniques, as you will find in the next section.
Continuous Profiling: Types and Techniques
Profiling should be a continuous and iterative task to enhance application performance and avoid bottlenecks. In addition, profiling should focus on the issues found in the production environment where issues are real rather than improving the pre-production environment. Optimizing the pre-production is not the right solution to avoid performance bottlenecks, as there are too many variables involved in actual production scenarios.
Although it's sometimes possible to use a routine to measure and test the performance of specific applications' components or tasks, replicating the exact behavior of the application in production is quite challenging or near impossible. Thus, continuous profiling is an integral part of modern application development as it enables developers to pinpoint performance bottlenecks and provides valuable optimizations.
Continuous code profilers are mainly categorized into two parts; Instrumenting Profilers and Sampling Profilers.
- Event-based profilers A method that uses the hardware performance event metrics to determine the number of events during execution. Examples of such events include clock cycles, data cache access, etc. Programming languages like Java, .NET, Python, and Ruby have event-based profilers.
- Instrumenting profilers The instrumenting profilers method involves collecting detailed timing in the function calls of the profiled application. It often has a high overhead cost due to inserting instrumentation directly into the application's code. However, they are used for troubleshooting I/O bottlenecks.
- Sampling profilers Also known as statistical profilers, this type of code profile involves sampling the profiled application's call stack at regular time intervals and then approximating the overall time-spent in an application. This type of code profile uses a profiler agent deployed on the host, which records the call stack. With the sampling profile, the profiler can identify the routine in execution and collect vital metrics such as memory usage, latency data, and CPU utilization.
Benefits of Need Continuous Profiling
The adoption of the continuous profiling technique enables developers to gain an insight into their code’s performance. This performance includes the consumption rate of limited but valuable resources, including disk I/O, CPU usage, memory, locks, garbage collection, or other tasks. When such resources deplete, they often cause the often dreaded application performance bottlenecks.
By finding and improving those parts of your code that are resource-hungry and eat all your resources, you have a higher chance to reduce bottlenecks and improve production assets.
Developers can benefit from a continuous profile with
- Lower effort to analyze and troubleshoot Continuous profiling makes comparing performance across different app releases and environments easy. It results in a lower effort required to discover performance bottlenecks, including the tiny ones, ultimately increasing the likelihood of continual performance improvement.
- Reduction of costs The most noticeable benefit is the significant decrease in the utilization of server resources. In addition, given how much the cloud environments would cost large organizations, code profiling would directly translate to reducing operations costs. In addition, since continuous profiling minimizes the amount of time spent by a developer to carry out performance tasks, the infrastructure cost becomes more achievable.
- Scalability and Reliability The overall scalability can also improve significantly due to the continuous elimination of performance bottlenecks. Furthermore, since bottlenecks are often the cause of production incidents, such as resource overloads, reliability can also improve by significantly reducing bottlenecks.
- Recover from poor performance in production environments When new deploys are introduced into production, it is not always a win-win situation. Sometimes metrics show poor performance when in production. Although, you could roll back to the last known stable deployment and perform a root cause analysis with the issues reproduced in a pre-production environment. Code profiling can help pinpoint the problem in the pre-production environment. But still, within a production environment, there are unpredictable aspects like load, which are difficult to replicate. Continuous profiling solves this challenge using the information from the current underperformance system (before rollback or release). It correlates data from the previous profile and quickly identifies the cause of the poor performance.
How to Implement Continuous Profiling?
So, what do you need to implement continuous profiling?
- A low-overhead sampling profiler for your language and runtime.
- A way to store the data from the profiler.
- A way to generate reports from the collected data.
Still, implementing any of the methods mentioned above is not a simple task. First, getting a low-overhead sample profiler ideal for production can be challenging. Second, developers may need to manage massive amounts of profiling data stored in a database. And third, gaining code profiling insights that lead to actionable insights via reports can be challenging without some automation.
However, large-sized companies have invested heavily in implementing continuous profiling. For instance, Google is an example of one such giant company. They published the article: Google-Wide Profiling: A Continuous Profiling Infrastructure for Data Centers, which details how they benefit from this practice. Another example is Atlassian, which uses continuous profiling services in production with Amazon CodeGuru Profiler.
The Best Continuous Profiling Solutions
Below are four popular code profiler solutions. Code profilers are usually offered via cloud-based services, including major cloud providers like (AWS and GCP) and others by popular APM and observability platforms.
Our methodology for selecting profiling tools:
Choosing the right profiling tool is mandatory for every business; hence, we have gone through deep research to find out the proven methodology to pick the right tool; here they are:
- Look for compatibility with Your Tech Stack
- Consider Ease of Integration
- Consider Performance accuracy
- Level of profiling and specific functions
- Real-time monitoring
- Clear and comprehensive visualization and reporting
- Look for support for distributed systems
- Go through its security and compliance
- Evaluate its costings and licensing
- Checkout its free trial for testing
1. Datadog Continuous Profiler
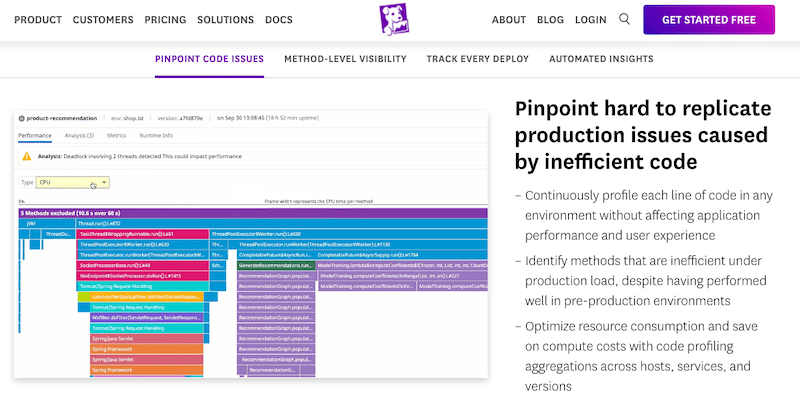
Datadog is a cloud-based infrastructure and application monitoring service. They offer the Datadog Continuous Profiler feature, which analyzes the code’s performance in any environment (including in-production) ongoing and with low overhead. It profiles each line of code without affecting the app’s performance and user experience.
Key Features:
- Compares and monitors code performance variation
- Supports CI/CD testing option
- It can be combined with APM
- Automated code profiling and suggestions
- Detects and optimizes the poor piece of code
Why do we recommend it?
It is compatible with .NET, Python, Go, Node JS, C++, Java, Ruby, and PHP. This tool is best at providing real-time insights into application performance across wider tech stacks to optimize and troubleshoot efficiently.
The profiler employs Datadog agents deployed on the application’s host. These agents collect metrics (CPU and memory) and events from hosts and then send them to the Datadog Cloud Platform for a performance data analysis.
Who is it recommended for?
Datadog Continuous Profiler is widely used by DevOps professionals, software engineers, and performance optimization experts. It is perfect for those seeking a comprehensive solution to profile and enhance the performance of applications that are run across multiple servers.
Pros:
- Provides quick insights into multiple servers through templates and prebuilt monitors
- Great interface, easy to use, and highly customizable
- Cloud-based SaaS product allows monitoring with no server deployments or onboarding fees
- Supports auto-discovery that builds network topology maps on the fly
Cons:
- Would like to see a longer 30-day trial
Subscribe to try a free 14-days trial.
EDITOR'S CHOICE
Datadog Continuous Profiler is our top choice because it can optimize resource consumption and cut computing costs. With code profiling aggregations spanning hosts, services, and versions, it provides a comprehensive solution for identifying bottlenecks, enhancing performance, and ultimately achieving efficient resource utilization in our dynamic development environment.
Download: Start a 14-day free trial
OS: Cloud-based
2. New Relic Thread Profiler
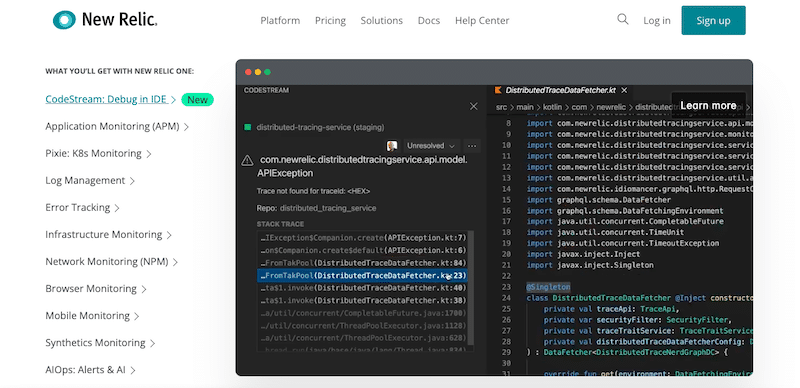
New Relic is an observability platform designed to monitor, debug and improve the entire stack. In addition, they offer the threat profiler feature, a low-impact low-overhead continuous profiler that can pinpoint applications bottlenecks found in production environments.
Key Features:
- Application and database monitoring
- Supports team collaboration
- View run-time data
- Transaction metrics and traces
- Application histograms and percentages
- Access to performance data API
Why do we recommend it?
The New Relic Thread Profiler is known for its Microsoft Azure certification, ensuring seamless monitoring in Azure environments. It has user-friendly admin dashboards, which makes the profiling process easy and offers clear insights into thread-level performance.
Remember that New Relic does not profile code but threads— paths followed when executing a program. The New Relic Thread Profiler uses agents installed on hosts that periodically poll the stack trace of each thread for a determined time, then send them to the platform.
Who is it recommended for?
Software developers and system administrators find this tool very helpful in optimizing and troubleshooting the intricacies of multi-threaded applications in various development and operational roles.
Pros:
- Certified for Microsoft Azure monitoring
- Uses anomaly detection to highlight abnormal behavior in your Azure environment
- Uses simple but intuitive admin dashboards
Cons:
- Better suited for small to medium-sized Azure networks
The New Relic Thread Profiler is only supported by specific agents and versions, including Java, .NET, Python, and Ruby.
Sign up to try New Relic for free.
3. Google Cloud Profiler
Google Cloud Profiler is a statistical and low-impact code profiler that continuously collects CPU and heap metrics from an application in production and profile data to improve performance. It allows developers to analyze applications deployed on the cloud or on-premises and supports Java, Go, NodeJS and Python; find more about the language support here: Google’s Cloud Profiler documentation.
Key Features:
- Real-time log management and analysis
- Built-in metrics observability at scale
- Health check and service monitoring
- Free service to Google Cloud users
- Stand-alone managed service for running and scaling.
Why do we recommend it?
Google Cloud Profiler performs robust tracking of CPU and memory activity. It operates continuously with a sample profiling strategy. It comprises two key elements – an agent and a server with an integrated dashboard for comprehensive monitoring and analysis of system performance.
The Google Cloud Profiler uses a profiling agent deployed in the application host. The profiler collects profiling information and sends it back to the Cloud Profiler, which in turn attributes data (including memory and CPU usage) to the application’s source code. The Cloud Profiler can help pinpoint areas within the application that are resource-hungry and create an overall map of the performance’s characteristics. Finally, the user can view the output using two graphical elements: an average resource usage visualization and a flame graph.
Who is it recommended for?
Google Cloud Profiler is used by engineers, software developers, and cloud administrators for live web applications. It is suitable to use in sandbox environments for thorough pre-release application testing. This tool is also used by experts to optimize and enhance the performance of applications hosted on the Google Cloud Platform.
Pros:
- Offers continuous profiling
- Free for Google Cloud users
- Simple interface – easy to use
- Extensively documented
Cons:
- Better suited for those using Google Cloud services
Subscribe to Google Cloud Platform to try Google Profiler for free.
4. Amazon CodeGuru
CodeGuru from Amazon AWS is an automated code reviewer and profiler designed to optimize application performance using Machine Learning (ML)-based recommendations. The Amazon CodeGuru continuously runs on production with low overhead. It analyzes the application’s runtime to identify and improve CPU and memory usage. This analysis results in faster and easier bottleneck troubleshooting and performance issues, including low throughput and high latency.
Key Features:
- False positive detections
- intelligent recommendations
- Anomaly detection.
- CI/CD integrations with Github actions
- Real-time application profiling
Why do we recommend it?
Amazon CodeGuru is well-known for its advanced profiling capabilities. The Profiler, through baselining and continuous statistics capture, eliminates the need for regular snapshots, ensuring consistent performance analysis. The best thing is it uses machine Learning, which standardizes profiling processes across applications, offering a more efficient and adaptive approach to performance optimization.
The code profiler also offers ML-powered commendations on discovering and optimizing resource-intensive methods within app coding. However, unlike the others, Amazon CodeGuru only supports Python and Java apps.
Who is it recommended for?
Amazon CodeGuru is mostly used for businesses involved in developing and supporting web applications, whether for in-house use or subscription services. It is suitable for those seeking advanced profiling and performance optimization tools to offer better web application experiences for both internal and external users.
Pros:
- Provides automated and manual profiling tools
- Generous 90-day trial period within AWS
- Leverages machine learning to discover easy optimization opportunities
- Uses simple visuals to illustrate areas for improvement
Cons:
- Better suited for those already using AWS
Try CodeGuru Reviewer for 90 days free with the AWS Free Tier.
Profile Data Visualization: Flame Charts
Profiling tools need to output either a profile (a statistical summary of events) or a trace (stream of events). Based on these outputs, continuous code profiling tools can provide visual representations of the data. One of the most valuable data visualization forms is the flame graph.
The majority of continuous profilers, including DataDog, AWS’s CodeGuru, and Google Cloud Profiler, display their profiling data using Flame Graphs. Flame graphs provide visualizations of distributed request traces or methods. Each service call’s “visually” representation during a request’s execution path uses a color-coded timeline of horizontal bars. For instance, CPU flame graphs display the CPU consumed by sample functions.
Below is a Flame Chart from Data Dog’s platform.
Flame Graphs are different than trees and traditional graphs, which usually are complex to follow and take up a lot of screen space. On the other hand, Flame Graphs display large amounts of information in an easy-to-read and compact form.
How to read a flame chart?
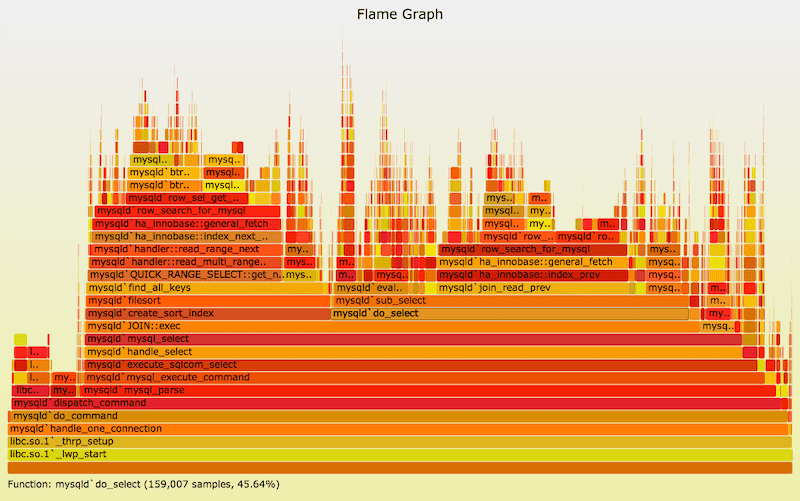
Each frame represents a function (mysql_execute_command, for instance), while the entire horizontal line (x-axis) represents the call stack methods (arranged alphabetically).
These horizontal lines are ordered from top to bottom (the y-axis), representing the call stack in a method-level hierarchy view. Frames within the x-axis represent the resource consumption or duration of the request. The larger or broader a frame is, the more resources (CPU and memory) are currently being consumed. This view can help quickly pinpoint the top consuming methods.
Conclusion
Traditional profiling techniques are not only resource-intensive, but they also have a high running cost, making them suitable only for short-term use.
Continuous profiling, on the other hand, is an advanced and modern profiling technique. It is a more efficient and effective means of discovering the areas that consume most resources by either a line of code, method, or component. With this information at hand, developers can understand the behavior of a profiled app and provide solutions to enhance the performance of an application.
This approach ultimately delivers faster and cost-efficient apps and makes end-users happy.
Continuous Profiler FAQs
How does continuous profiling work?
Continuous profiling works by running a profiler on the application, which collects data about the application's behavior as it runs. The profiler can collect information such as CPU utilization, memory usage, and call stack traces, among other things. This data is then analyzed and presented to the developer in a way that makes it easy to identify performance bottlenecks and memory leaks.
Why is continuous profiling important?
Continuous profiling is important because it helps developers identify performance issues early in the development process, before they become major problems. By profiling the application in real-time, developers can quickly identify areas that need optimization and make changes to improve the application's performance.
What are the benefits of continuous profiling?
The benefits of continuous profiling include improved application performance, reduced memory usage, and faster problem resolution. Additionally, continuous profiling can help prevent bugs and security vulnerabilities from being introduced into the application.
What tools are available for continuous profiling?
There are several tools available for continuous profiling, including commercial tools like DataDog, New Relic, and Google Cloud Profiler, as well as open-source tools like perf, gperftools, and valgrind. The choice of tool will depend on the specific needs of the application and the development team.
How can developers integrate continuous profiling into their workflow?
Developers can integrate continuous profiling into their workflow by using a profiling tool that integrates with their development environment. For example, some profilers have plugins for popular Integrated Development Environments (IDEs) like Eclipse and Visual Studio. Developers can then run the profiler on their application as they work, and use the profiler's output to optimize their code and improve performance.