We may earn a commission if you make a purchase through the links on our website.
The Best Elasticsearch Monitoring Tools
UPDATED: March 17, 2025
On the hunt for the best Elasticsearch monitoring tools? We’ve got you covered. We’ll be testing out and reviewing the best Elasticsearch monitoring tools on the market to see what makes them so great.
Here is our list of the best Elasticsearch monitoring tools:
- SolarWinds Server & Application Monitor – FREE TRIAL Offers full visibility into Elasticsearch as well as other cloud and on-premises servers. Start a 30-day free trial.
- AppOptics Application Performance Monitor – FREE TRIAL Developer-focused platform that offers detailed troubleshooting tools with root cause analysis to speed help improve uptime and performance. Get a 30-day free trial.
- ManageEngine Applications Manager – FREE TRIAL This package for software and platform performance tracking allows the monitoring of Elasticsearch implementation on premises and on the cloud. Runs on Windows Server, Linux, AWS, and Azure. Download a 30-day free trial.
- Site24x7 – FREE TRIAL A great option for cloud-based out-of-the-box monitoring, reporting, and alerts. Access a 30-day free trial.
- Datadog Offers network, infrastructure, and application monitoring to cover all aspects of your Elasticsearch engine.
- Dynatrace Uses AI-powered tools combined with an intuitive UI for monitoring across enterprise-sized organizations.
- Opsview Has a plug-and-play Opspacks that lets you start monitoring Elasticsearch and its supporting infrastructure quickly and efficiently.
- ElasticHQ Focused solely on Elasticsearch, the platform offers an open-source form of monitoring that is independent of your clusters and nodes.
- Paessler PRTG Customizable sensors that are configured to monitor specific aspects of both Elasticsearch, as well as its supporting network, container, and infrastructure.
The Best Elasticsearch Monitoring Tools
Our methodology for selecting Elasticsearch monitoring tools
We reviewed various Elasticsearch monitoring tools and analyzed the options based on the following criteria:
- Support and integrations for Elasticsearch
- Root cause analysis options
- Distributed tracing support
- Graphical interpretation of data, such as charts and graphs
- Free trial period, a demo, or a money-back guarantee for no-risk assessment
- Good price that reflects value for money when compared to the functions offered
1. SolarWinds Server & Application Monitor – FREE TRIAL
SolarWinds Server & Application Monitor (SAM) is another tool that can monitor multiple aspects of your network and centralized monitoring efforts across the board. Custom sensors can be deployed to monitor Elasticsearch environments, and allow organizations to cover all of their bases by monitoring the server, the engine, and the supporting network infrastructure. This additional monitoring may seem like extra work, but will significantly reduce the amount of troubleshooting time you’ll waste hunting down bottlenecks when they do rear their heads.
Key Features
- Unified Monitoring: Allows you to manage server performance, application performance, and infrastructure health in one platform, whether on-premises or in a hybrid and/or cloud environment.
- Application Dependency Mapping: Automatically uncovers application dependencies, which helps cut down on time for problem debugging.
- Customizable Dashboards and Reporting: Provides customizable dashboard and reporting tools to visualize performance stats and track the fulfillment of SLAs, capacity, and forecast data.
- Alerting and Automation: Useful in terms of high-level alerting, and automation of actions according to specific user-defined triggers in order to comply with or foresee issues.
Why do we recommend it?
We recommend SolarWinds Server & Application Monitor because it helps you keep an eye on your servers. If you are an organization that needs to deal with a high volume of data on cloud infrastructure, then this tool is a great addition as it supports proactive monitoring. It has lots of monitoring templates, like blueprints, for different types of servers. It keeps watching your servers all the time, even if they're in different places like private or public clouds. It can also look at different parts of your IT setup and see how they relate. Plus, it's flexible, so you can keep an eye on special programs you use too.
These monitors can be deployed to monitor cluster health, resource utilization, and performance on the query level. The platform has no trouble scaling, no matter how large your clusters or network are, and features over 1200 monitoring templates with additional community-created templates for integrations not covered by SolarWinds themselves. Outside of standard log data and Elasticsearch metrics, SAM can build dynamic network maps that provide a live look into your Elasticsearch environment, and supporting architecture.
If a problem arises that isn’t easily tied to an aspect of your search engine, SAM can help provide a visual cue as to where a bottleneck might be occurring. For deeper troubleshooting root cause analysis can be applied to help guide administrators in the right direction and get issues resolved quicker.
Who is it recommended for?
Server & Application Monitor is recommended for Linux experts. It offers ready-made templates specifically for monitoring Linux applications and servers. With the help of these templates, you can keep a constant watch on your Linux systems and quickly solve any performance problems. It has deep diagnostic tools and automated monitoring features, which will make experts work more easy to troubleshoot complex issues and systems run smoothly.
Pros:
- Centralized Platform: Offers all-round readings from the server, application, and network sides all viewable from a centralized platform.
- Pre-Built Templates: Delivers pre-built, but also adjustable, templates for IT infrastructure monitoring, suitable for various IT settings.
- Smart Alerts: Implementation of the intelligent alerting system which assists in a timely detection of problems and addressing them before they affect your users.
- Fits Small and Medium Business: Initially a popular choice for small to medium-sized businesses, it is increasingly becoming known as a viable solution for larger enterprises with growing requirements.
Cons:
- Not a Budget-Friendly Choice: Provides a lot of options, but the expensive fee after the free trial might not be welcome for a budget or small-sized organization.
You can test out SolarWinds Server & Application Monitor completely free through a 30-day free trial.
EDITOR'S CHOICE
SolarWinds Server & Application Monitor is our editor's choice for various reasons. First, its custom monitoring options, such as REST API, WMI, SNMP, and PowerShell scripts, offer maximum flexibility and adaptability. Furthermore, its customizable server monitoring allows the organization to easily meet individual customer needs more accurately than its competition. The best part is infrastructure dependency mapping; it gives the user an improved understanding of the network. It has also proven results in server monitoring solutions with advanced features like the AppStack dashboard for easy views and troubleshooting.
Download: Download a 30-Day Free Trial
Official Site: https://www.solarwinds.com/server-application-monitor
OS: Windows Server
2. AppOptics Application Performance Monitor – FREE TRIAL
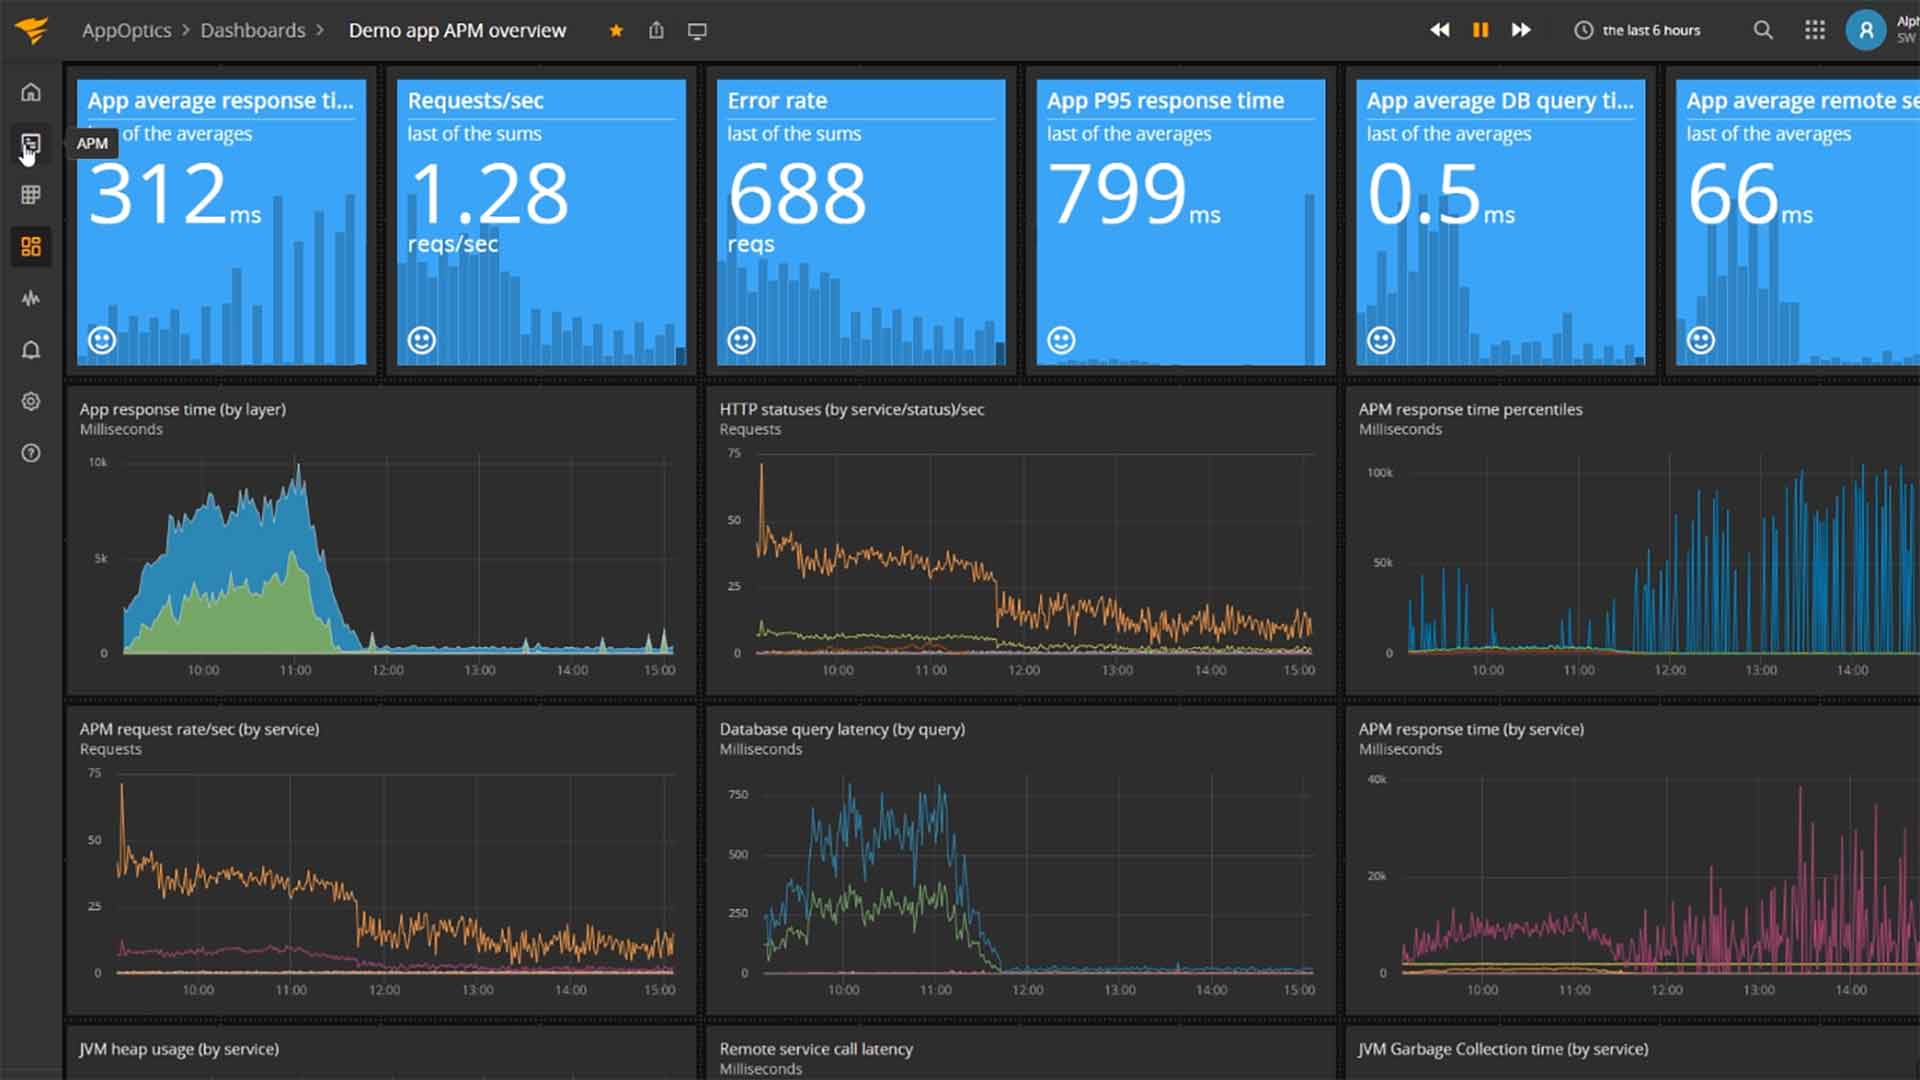
AppOptics takes a more focused approach on Elasticsearch monitoring and is a great choice for someone looking to only monitor their Elasticsearch metrics. The monitoring platform offers a host of different ways you can ensure you’re monitoring the correct metrics through specific Elasticsearch templates and customizable analytic dashboards.
Key Features:
- Real-Time Performance Monitoring: Offers instant signals of application performance and infrastructure statistic collection, then helps to discover the trouble spots.
- Tracing and Distributed Tracing: Provides detailed transaction tracing and distributed tracing operations with a decent visualization of how microservices communicate and collaborate.
- Cloud and Hybrid Monitoring: Categorically keeps track of applications wherever they are be it on cloud, onsite proprietor-run environments, or the hybrid kind.
- Custom Metrics and Dashboards: Generates specific metrics and dashboards to adapt to particular monitoring tasks depending on different objectives and goals.
Why do we recommend it?
AppOptics performance monitoring is recommended because it offers comprehensive coverage of applications, servers and transactions – from auto-instrumentation and one-click log connections to clear summaries that help all stakeholders understand what might be causing issues – making this suitable for beginners as well as experts alike. AppOptics makes monitoring useful to all.
Once you’ve chosen exactly what you want to monitor in Elasticsearch, you can create simple alerts centered around the conditions you specified and have those alerts trigger notifications that can be sent to third-party apps, email, or a host of other custom options via webhook.
Master nodes can be monitored to ensure they’re coordinating tasks properly while also tracking clusters to ensure that data is being stored and organized correctly. AppOptics does a solid job at combining high-level health insights with the option to dive deep into specific Elasticsearch metrics right from one screen.
All Elasticsearch log data can be stored and searched to help pinpoint performance issues as well as to compare current performance benchmarks to past performance. Full-text search allows for a range of integrations into the collected data including business intelligence integrations, and security intelligence systems like a SIEM platform.
Who is it recommended for?
AppOptics is widely utilized by professionals requiring the management of hybrid and cloud setups. Its color-coded heatmaps offer an accurate picture of how hosts and containers are performing, helping prevent unexpected shutdowns while alerts on key performance measures allow experts to detect issues early. Working across AWS and Azure platforms seamlessly, AppOptics makes an invaluable asset to anyone needing to quickly detect and fix issues within their systems.
Pros:
- Transaction Recording: Offers sophisticated performance metrics with the transaction recording capabilities for you to identify stumbling blocks within complex applications.
- Apps and Infrastructure Monitoring: Elegantly ties in with the incorporated infrastructure monitoring so that the whole system provides full overview of both applications and infrastructure.
- Real-Time Analysis: Provides real-time analysis and the possibility of configuring dashboards to monitor application health and performance.
- Flexible to the Organization: Aligns with the application infrastructure, scales to different sized organizations, including large and small companies.
Cons:
- Trial Period: The trial period could be longer in order to fully understand the tool and its functions.
Infrastructure & Application Monitoring through AppOptics starts at $24.99 per month when billed annually and includes features such as distributed tracing, live code profiling, and trace level root cause analysis summaries. You can test out AppOptics Application Performance Monitor completely free through a 30-day free trial.
3. ManageEngine Applications Manager – FREE TRIAL
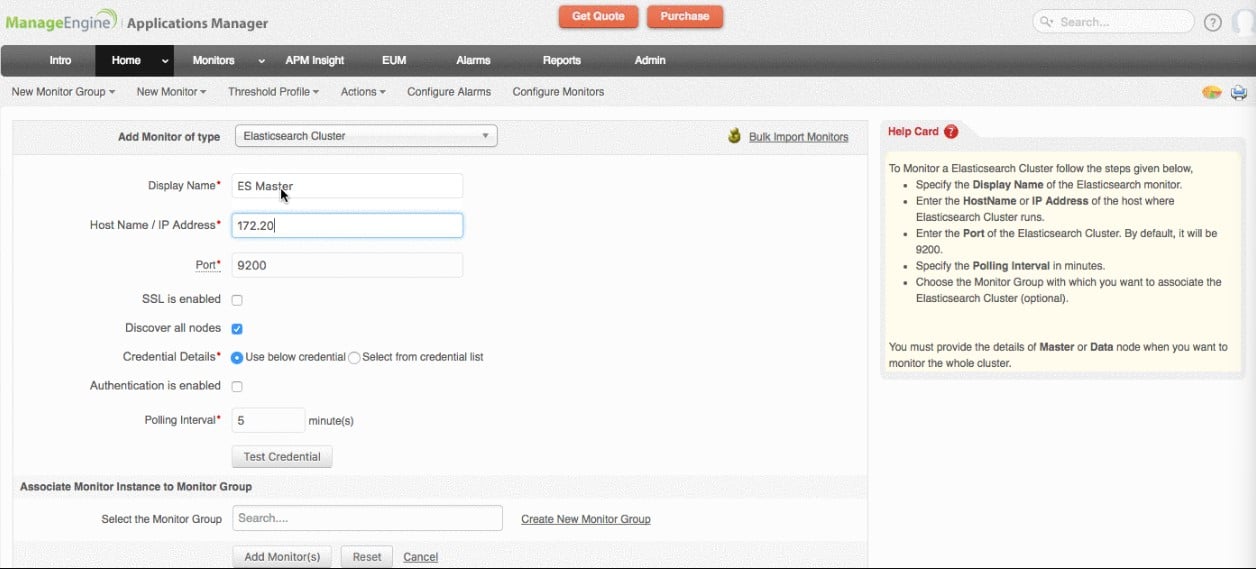
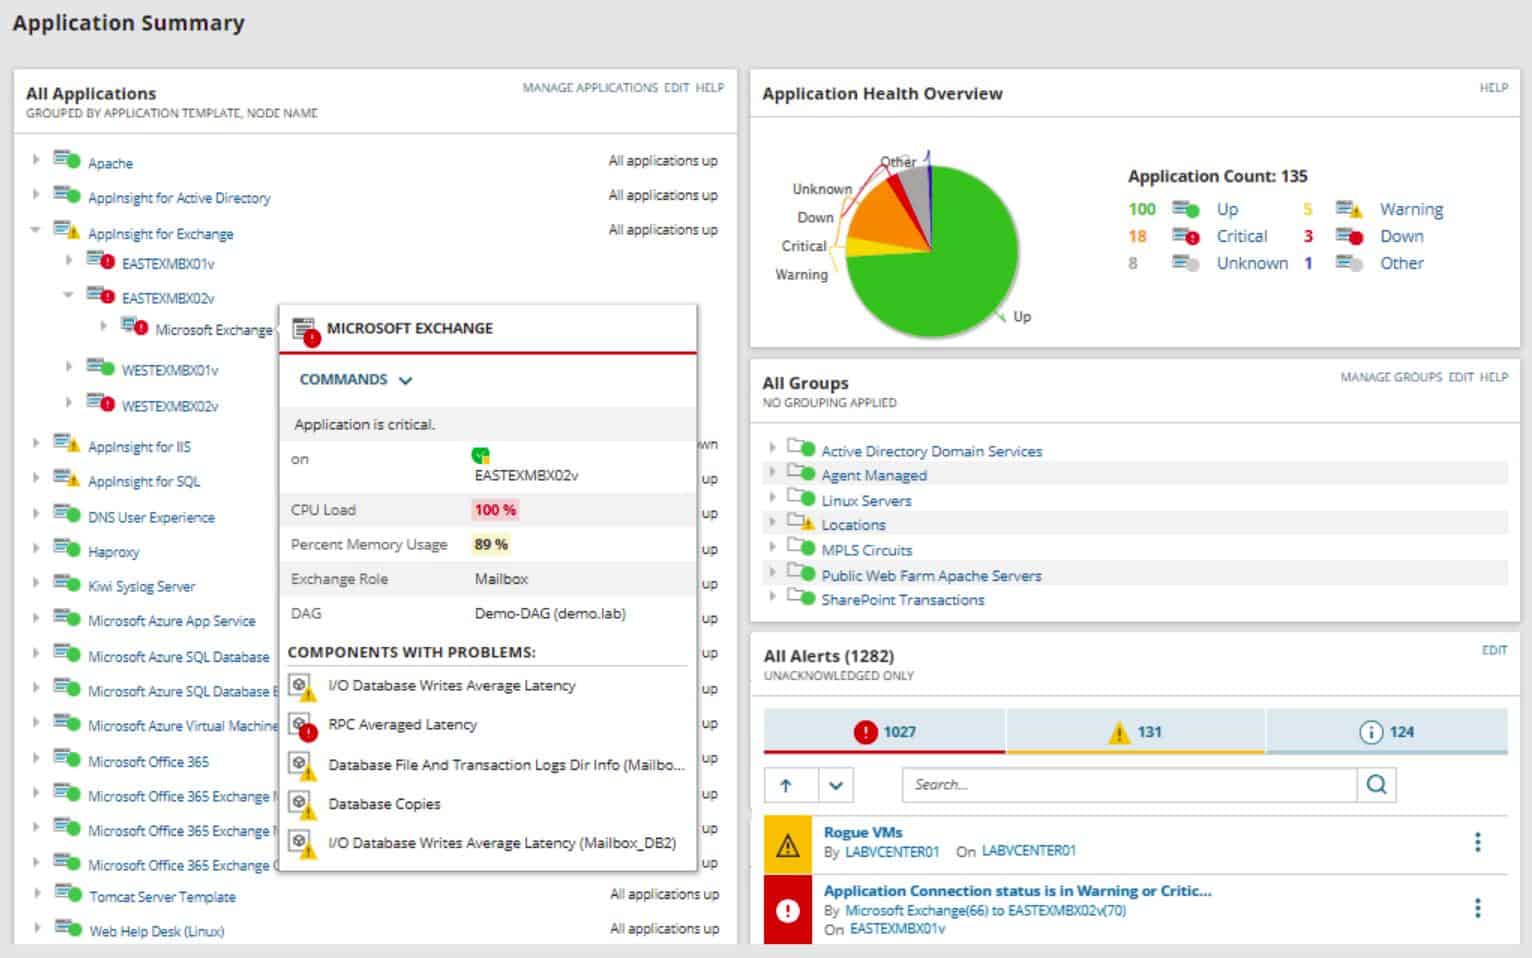
ManageEngine Applications Manager provides monitoring for software and services on-premises and on cloud platforms. The system is able to monitor a long list of software packages and can easily be set up to add new monitoring services. Elasticsearch is one of the packages that the Applications Manager has integration for.
Key Features:
- Application Performance Monitoring: Supplies exact responsiveness measurement, keeping the end user's experience at a high level.
- Database Monitoring: Enables the comprehensive monitoring of different databases, certifying the health and performance of all implemented databases.
- Server Monitoring: Allows monitoring of different server types, including web servers, application servers, and database servers.
- Anomaly Detection and Root Cause Analysis: Machine learning is the focus, which gains insight into anomalies by use and assists in speedy resolution of performance faults.
Why do we recommend it?
ManageEngine Applications Manager is our go-to recommendation for keeping an eye on Elasticsearch servers. It gives you all of the details on your cluster's nodes and shards so that you can better assess how they're doing, such as health metrics or runtime metrics. It also keeps tabs on threads and configurations real time so any issues can be caught before becoming bigger.
After you activate the Elasticsearch extension, you will get an extra screen in the Applications Manager dashboard that shows the activity of your instance with respect to its database-style activities, such as indexing, sorting, and filtering. The system maintains a table of these statistics.
While tracking activity within the Elasticsearch instance, the service also looks at server resource activity. This identifies the CPU, memory, and disk access by the Elasticsearch instance and also looks at the total resource availability.
If other applications are running at the same time, they will also use up part of CPU and memory capacity. The Applications Manager system calculates the full requirements of all running processes and will predict if the system resources are about to run short.
The tool generates predictive alerts if it forecasts resource shortages. Those alerts appear in the Applications Manager console but you can also set up the system to send notifications to specific technicians. These can be sent by email, SMS, Slack message, or Service Desk ticket.
The Applications Manager system generates an application dependency map for your entire system. This can be particularly useful for Elasticsearch implementations, which can often be integrated into other applications. You might not realize that you have an Elasticsearch system running at the heart of one of the data management, security monitoring, or performance tracking systems you bought.
Who is it recommended for?
Applications Manager is recommended for experts who want to manage Elasticsearch clusters. It gives ideas and useful insights about how your resources, like CPU and memory, are being used. It allows users to make changes accordingly, like expanding the network or making modifications. It includes real-time monitoring and sends quick alerts when it detects sudden changes in resource usage. Other than this, the Applications Manager gives experts the insights they need to keep their Elasticsearch clusters running smoothly.
Pros:
- Monitors Different Categories of Apps: Complete monitoring facilities for different categories of applications, separate servers, databases, and web services.
- Real Browser Monitoring: Contains synthetic monitoring and real browser monitoring to secure the best final user experience.
- Super Speedy Troubleshooting: Provided with a mechanism that can automatically detect factors that trigger problems, hence speeding up the troubleshooting to minimize the downtime.
- Customizable Dashboards: Detailed reporting features for in-depth analytics reporting and analysis.
Cons:
- Setup Can be Time-Consuming: Complex and time-consuming procedure involved in setting up a system, especially for organizations with a complicated IT structure.
ManageEngine offers three editions of Applications Manager. The first of these is the Free edition, which will monitor five assets. The Professional edition is sized for small businesses with a starting price of $395 per year – larger companies can pay extra for greater monitoring capacity. The top plan is called Enterprise and it is aimed at large, multi-site businesses. The base price for this edition is $9.595 per year.
The software for Applications Manager will run on Windows Server or Linux. The package is also available as a service on Azure Marketplace and AWS Marketplace. You can assess Applications Manager with a 30-day free trial.
4. Site24x7 – FREE TRIAL
Site24x7 is a cloud-based monitoring tool that has the ability to monitor database performance, server health, network statistics, and overall infrastructure insights. The platform is designed to make monitoring as out of the box as possible and features a host of templates for dashboards, reports, and alert profiles.
Key Features:
- Website Monitoring: Offers website uptime and performance monitoring from over 100 locations worldwide.
- Real User Monitoring (RUM): Provides insights into real user experiences across web applications to help improve performance and satisfaction.
- Application Performance Monitoring: Includes in-depth monitoring for applications, including detailed transaction tracing for performance optimization.
- Infrastructure Monitoring: Monitors critical infrastructure components such as servers, VMs, and network devices to ensure health and performance.
Why do we recommend it?
Site24x7 is a superb tool for Elasticsearch monitoring, and it is like a super smart search engine for big data. Users can easily install plugins and keep an eye on them to check how well your Elasticsearch setup is doing. The tool provides detailed metrics and configurations so there is no more stress, and it will always keep you tuned with a clear picture.
Since the tool is hosted in the cloud, there are no lengthy installs or complex onboarding processes to get started. The agent just needs to be on the same network as your Elasticsearch engine, or on the same server, it is hosted on.
In terms of monitoring Elasticsearch, Site24x7 has a simple integration that attaches to the default install agent that immediately gives the collector the ability to see and report conditions in your Elasticsearch environment. Performance metrics like active and initializing shards, as well as node and cluster information, are made available through a centralized home screen where you can completely customize the look at feel for your real-time monitoring view.
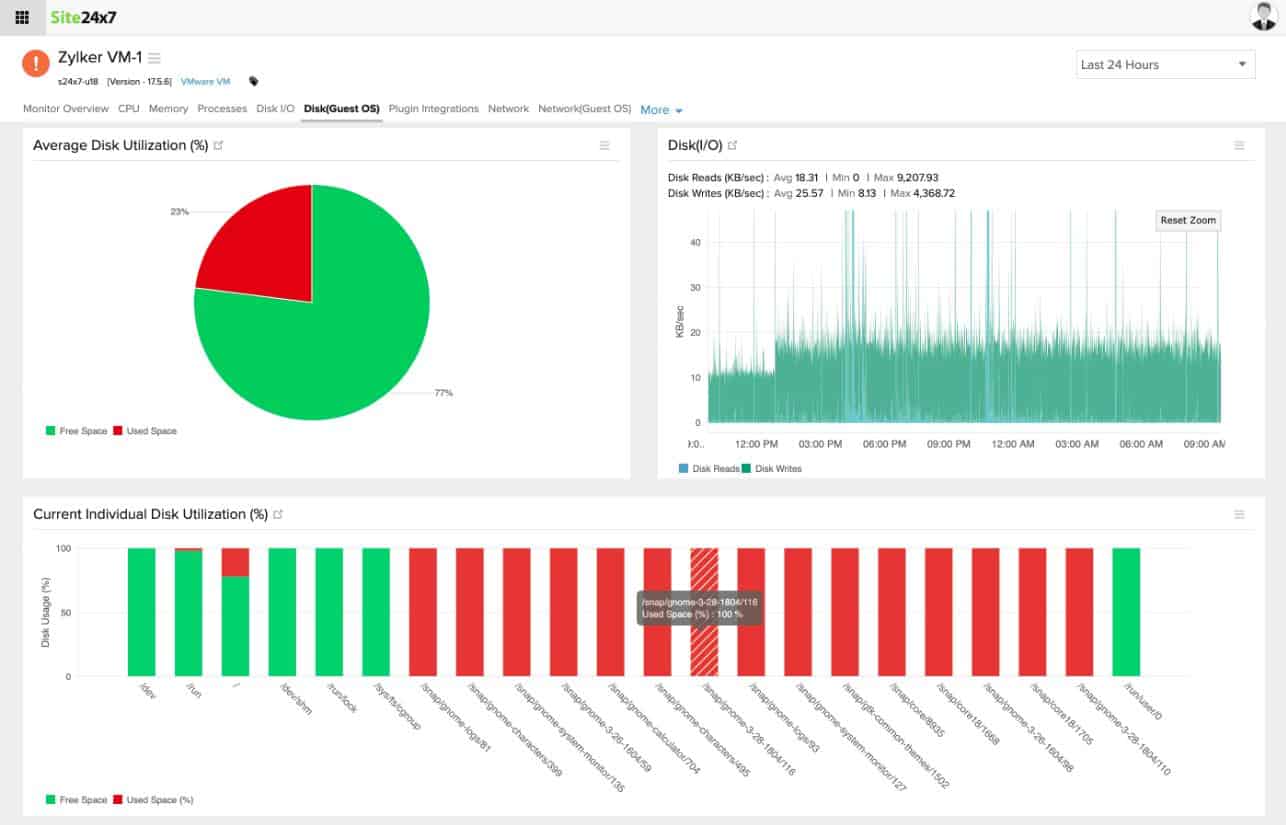
Since Elasticsearch depends on the machine it's installed on, the Site24x7 agent can collect information about the server environment where Elasticsearch is installed. CPU usage, memory, allocation, and disk i/o are all able to be recorded and reported back to the main dashboard.
Since Site24x7 is so flexible the same agent can be used to monitor other areas of the network, making the platform a great fit for organizations who are looking to develop a holistic monitoring strategy across all of their assets.
Who is it recommended for?
Site24x7 is best suited for experts who manage Elasticsearch clusters. It will help experts understand how their clusters are operating by offering comprehensive insights into cluster status, nodes, shards, and JVM information. This tool specializes in monitoring CPU usage across various node types. This will help users analyze the workload distribution and keep performance up to the mark.
Pros:
- Monitors Everything: Provides a comprehensive monitoring solution covering websites, servers, clouds, applications, and real-user monitoring from a single platform.
- Supports Global Locations: Offers multiple global locations for website and web application monitoring, ensuring performance is measured accurately across different geographies.
- Easy to Use at Technical Levels: Features an intuitive and easy-to-navigate user interface, making it accessible for users of all technical levels.
- More Integrations: Supports a wide range of integrations with popular tools and services, enhancing its functionality and flexibility.
Cons:
- Sends False Positives and Alerts: Users may find the volume of alerts and notifications to be overwhelming, especially if not fine-tuned properly.
Pricing for Site24x7 is subscription-based and starts at $35.00 per month for application monitoring when paid annually. This package provides up to 500MB of log storage, third-party integrations, and monitoring of up to three different applications.
Any additions you may need like more log storage, or additional servers, are offered as à la carte add ons, meaning you’ll never get stuck paying for a package deal with features you never intend on using. You can start with a 30-day free trial.
5. Datadog
Similar to Site24x7, Datadog offers an entire cloud-based suite of monitoring tools to measure metrics from servers, applications, and entire network infrastructures. Datadog agents can be configured in a number of different ways to monitor many different environments, including Elasticsearch engines.
Key Features:
- Integrated Cloud Monitoring: Offers an integrated suite for monitoring cloud infrastructure, applications, and services in real-time.
- Log Management and Analytics: Integrates log management and analytics to provide deeper insights into system and application performance.
- AI-Powered Anomaly Detection: Uses artificial intelligence to detect anomalies in performance data, facilitating proactive issue resolution.
- Customizable Dashboards and Collaboration: Provides customizable dashboards and collaborative tools for sharing insights and alerts across teams.
Why do we recommend it?
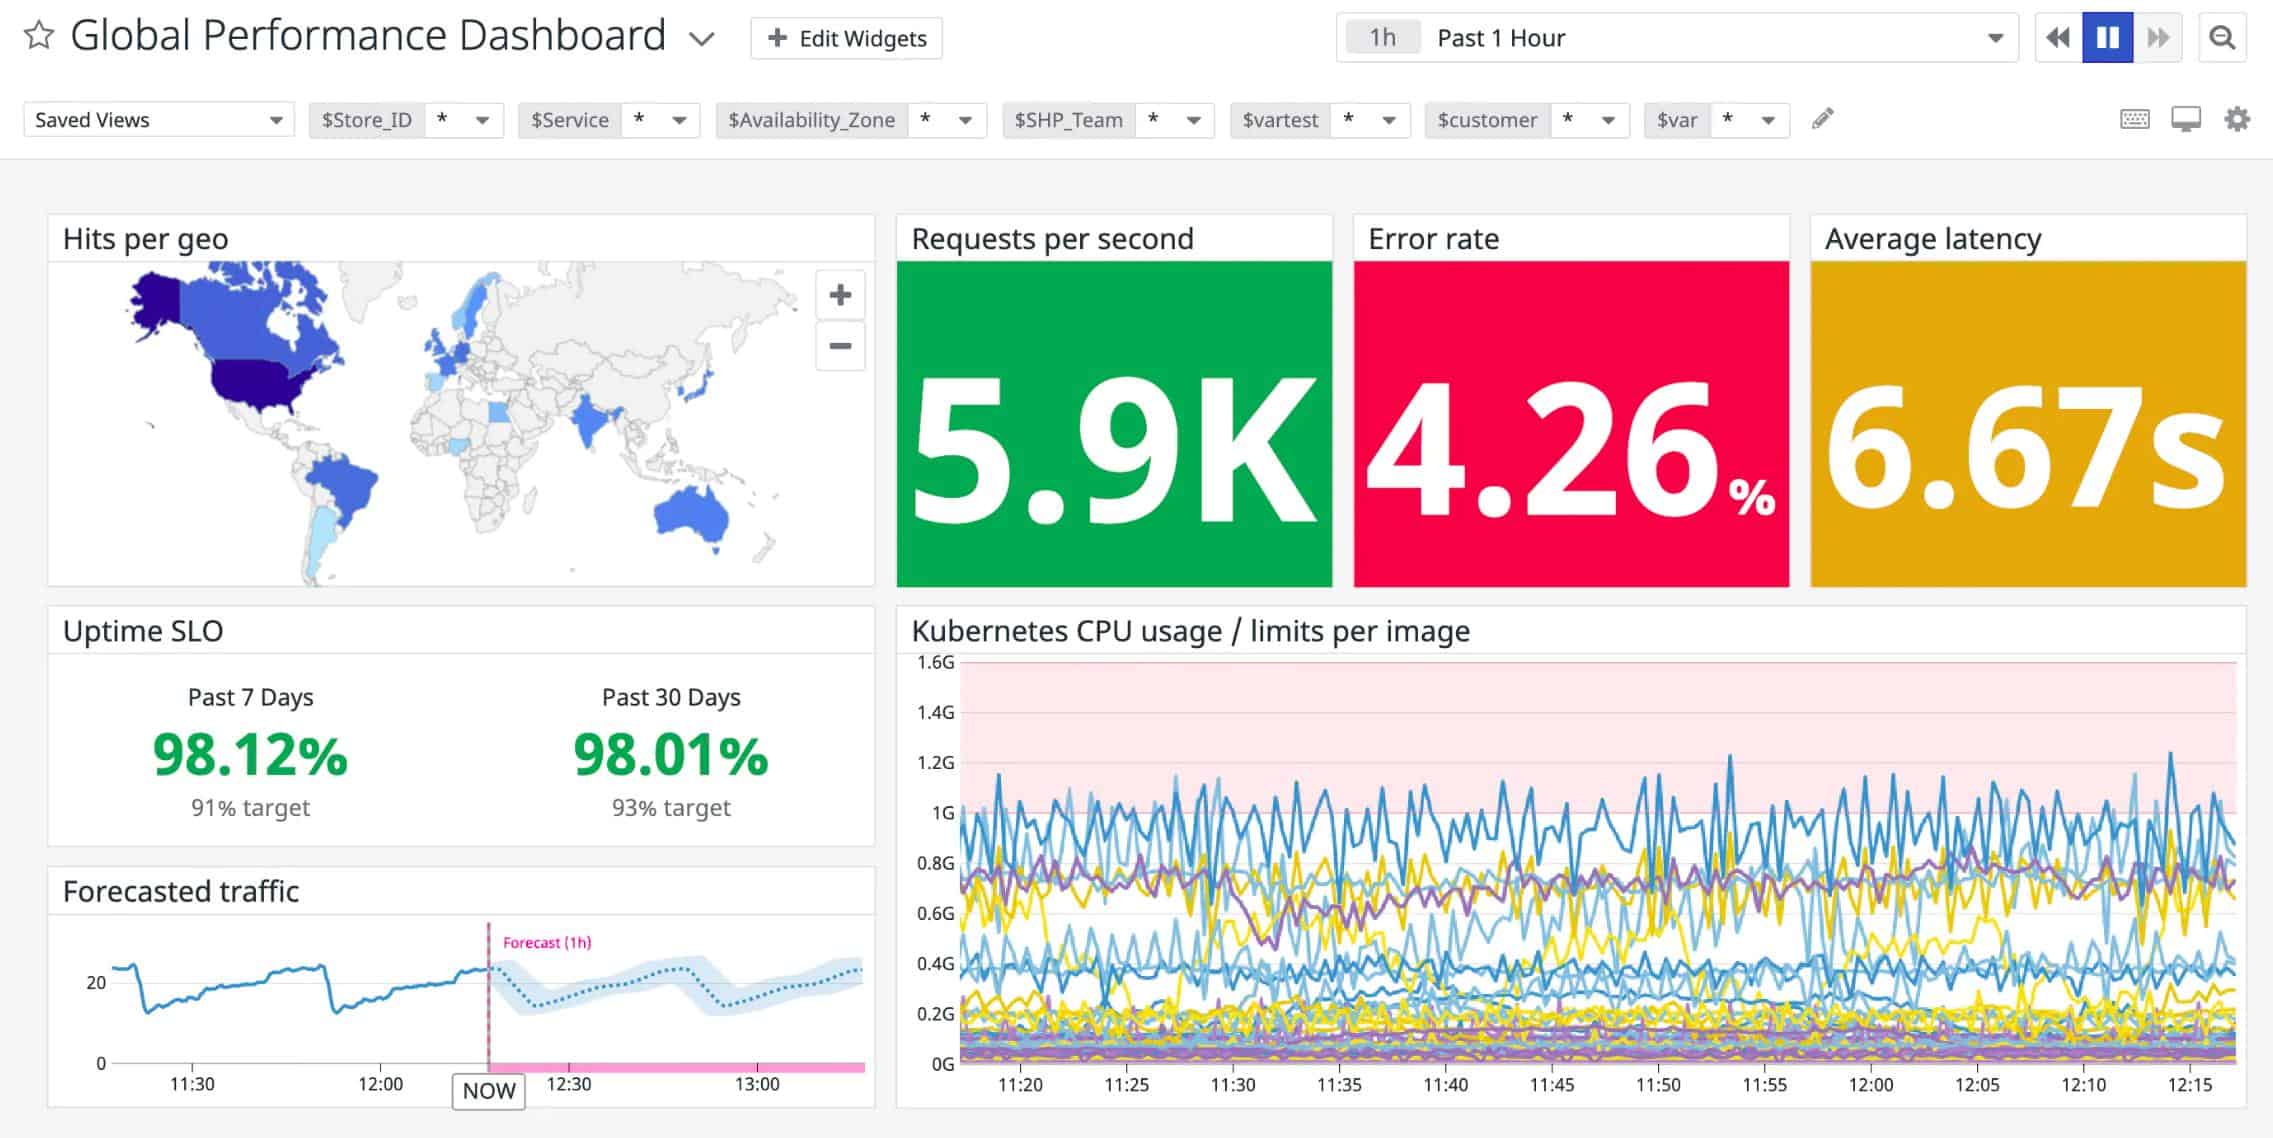
For Elasticsearch, we recommend Datadog since it keeps all of your key information in one location. Its open-source Datadog Agent software gathers and displays logs, traces, and analytics from every node in your system. With the pre-made dashboard that Datadog provides, you can quickly gain a deeper understanding of your clusters. It displays important performance data. Even more information can be added to this dashboard to suit your needs, such as CPU and memory use.
The platform aims to create as many out-of-the-box features as it can, coming complete with templates for reports, alert monitors, and dashboards. All dashboard views can be customized through a simple widget editor. Once configured, they can be saved and shared with individuals, or entire teams.
The monitor can measure specific health metrics around certain queries, or the real-time and performance metrics around clusters. The integration includes a log-processing element that automatically searches your Elasticsearch log files for relevant events and information. That information is then pulled into a central dashboard where it can be visually displayed, and compared against your past performance, or current SLAs.
For alerts, you can set notifications based on threshold or condition, and tie them to events that either impact Elasticsearch itself, or its supporting environment. Nodes can be tagged for smarter more targeted alerts, which is especially helpful in larger clusters. Some of the most common alerts are garbage collection time and latency thresholds. These conditions are easily tied to actions such as a notification or remediation event.
Who is it recommended for?
For specialists that oversee Elasticsearch clusters, Datadog is the best fit for them. It helps to keep all the clusters operations updated, including JVM memory consumption and general health. It sends notifications about operations such as capacity additions or configuration adjustments. Hence, they can monitor the impact of these modifications on cluster performance. Moreover, with Datadog's Elasticsearch check, you can get complete insights into the cluster performance by collecting a wide range of data, such as disk space, memory consumption, node availability, search and indexing performance, and more.
Pros:
- Log Management: Offers an integrated suite for monitoring, security, and log management, providing a holistic view of IT infrastructure.
- Perfect for Cloud-Native Apps: Excellently-suited for monitoring cloud-native applications and infrastructure, with extensive support for Kubernetes and container monitoring.
- Analytics and ML Capabilities: Advanced analytics and machine-learning capabilities for predictive monitoring and anomaly detection.
- Community Support: Boasts a strong community and a vast array of integrations with other tools and services.
Cons:
- May Find it Expensive: Pricing model can get expensive as you scale, particularly for small businesses or startups with tight budgets.
Pricing for Datadog APM starts at $31.00 per host, per month and includes trace correlation as well as historical and live log analysis. You can test out Datadog completely free through a 14-day trial.
6. Dynatrace
Dynatrace combines AI-powered features with detailed troubleshooting tools that support monitoring for a multitude of environments including Elasticsearch engines. Dynatrace takes a minimalist approach to its user interface which helps prevent developers from being overwhelmed when managing multiple clusters, databases, and servers for enterprise environments.
Key Features
- Full-Stack Monitoring: Delivers AI-powered, full-stack monitoring from the front end to the back end, including infrastructure, applications, and user experience.
- Automatic Root Cause Analysis: Features automatic root cause analysis to quickly identify and resolve performance issues.
- Digital Experience Monitoring: Includes comprehensive monitoring for user experience across web, mobile, and IoT applications.
- Cloud-Native Support: Offers extensive support for monitoring cloud-native technologies, including Kubernetes, microservices, and serverless architectures.
Why do we recommend it?
Dynatrace is a flexible solution that will help professionals with solving a range of organizational difficulties, which is why we recommend it. Dynatrace meets several needs, including performance monitoring, security enhancement, data analysis, and task automation. It gives a complete insight into every aspect of their online applications, including databases and web services. Thanks to its observability features. Overall, its the best tool for everyone who wants to increase the productivity and performance of their company because it expands and changes to meet new difficulties.
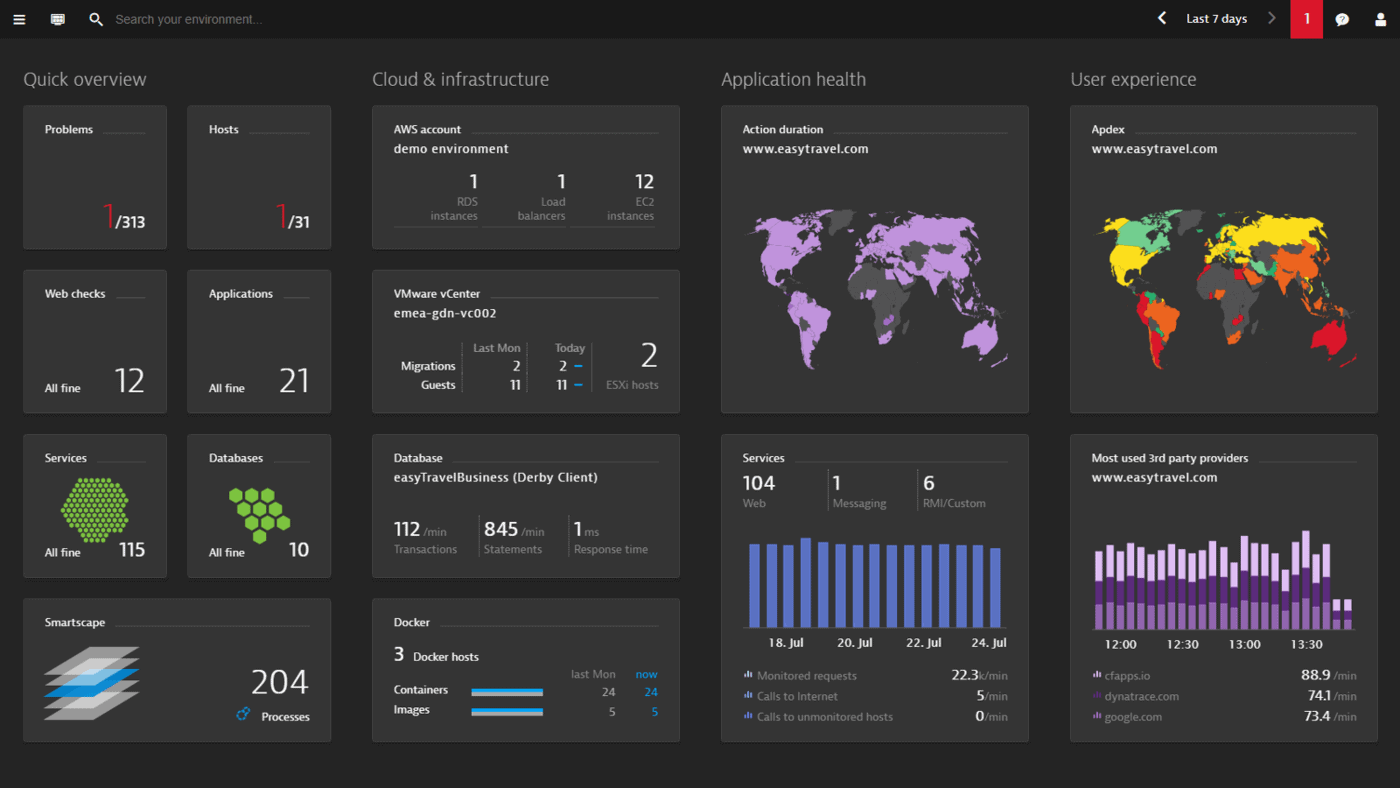
Once the agent is running, you’ll start off with a high-level look into the components of your Elasticsearch clusters, and be able to drill down into the query level quickly to find problem nodes, and ultimately the bottleneck. The drill-down feature is paired with intelligent root cause analysis that scans the node and helps guide the user to exactly where the issue is stemming from.
The agent utilizes an auto-discovery feature that can automatically track new individual nodes or clusters, and gather metrics about them. Insights on active, unassigned, or relocating shards are all captured and reported to the main dashboard. Metrics focused on the indexing time, number of total queries, and total search time can paint a picture into the performance of each node and allow sysadmins to have a more granular look into their Elasticsearch environments.
Dynatrace is constantly applying AI-powered monitoring tools to your Elasticsearch engine to provide continuous monitoring, root cause analysis, and maps of impacted dependencies. The platform was built to serve larger organizations and features over 500 different integrations into third-party technologies.
Who is it recommended for?
Experts wishing to track and enhance their apps' performance are advised to use Dynatrace. It functions by monitoring all designated applications to ensure their seamless and effective operation. Dynatrace manages several processes concurrently because of its focus on artificial intelligence, digital performance management, and application performance management. Thanks to its intuitive UI, which has a ton of contemporary features built right in, experts can quickly access all application data. It's an effective technique for maximizing application performance and availability.
Pros:
- AI for Problem Detection: Utilizes artificial intelligence for automatic problem detection and root cause analysis, reducing manual troubleshooting efforts.
- Full Stack Technology: Offers comprehensive monitoring capabilities across the full technology stack, from application performance to infrastructure health.
- Provides Satisfactory User Experience: Includes advanced user experience monitoring tools to track and improve customer interactions.
- Scalable: Designed for large enterprise environments, offering high scalability and performance.
Cons:
- Might be Tough in Configuring: Extensive features and capabilities may introduce a steep learning curve and complexity in configuration and management.
Pricing for Dynatrace full-stack monitoring starts at $69.00 per month when billed annually and includes 8GB of data per host. You can test out Dynatrace for free through a 15-day trial.
7. Opsview
Opsview offers multiple solutions for monitoring the cloud, network, server, and infrastructure for many different organizations. The Opsview agent is flexible and can be configured to monitor many different applications. Many integrations are built into the platform through what the company calls Opspacks.
Key Features:
- Comprehensive IT Infrastructure Monitoring: Monitors a wide range of IT infrastructure components, including networks, cloud services, and applications.
- Business Service Monitoring: Allows the creation of business service dashboards to map IT performance to business outcomes.
- Scalability: Designed to scale with your business, suitable for both small and large enterprise environments.
- Customizable Alerting and Notifications: Offers highly customizable alerting and notification systems to ensure the right people are informed of issues immediately.
Why do we recommend it?
We recommend Opsview because it is a complete application and infrastructure monitoring suite. It includes Opspacks, or plug-ins, to increase its capability. An Opspack specifically designed for Elasticsearch monitoring is available. Opsview enrolls all of your Elasticsearch settings and offers a consolidated overview of performance metrics whether you're using the cloud-based version or the on-premises Linux version. It's a useful tool for keeping an eye on Elasticsearch implementations because it's simple to drill down into each instance for a comprehensive examination.
These Opspacks contain pre-configurations that allow you to start monitoring your Elasticsearch engine quickly without any custom coding or set up. The agent can monitor virtually all metrics pertaining to Elasticsearch through a series of service checks that can then be paired with alerts or action if their conditions reach specific thresholds.
The Opspacks are convenient because they also include dashboard and alert templates that are tailored to Elasticsearch environments. These are designed to be ready to use right away but can be modified and changed after deployment.
Metrics like JVM uptime, filesystem capacity, average load, and memory usage are all captured and then reported back to the Opsview dashboard for analysis. Opsview has a number of automation features that can be paired with scripts or alert notifications to ensure the right person or team is notified of specific conditions.
For example, automation can be set up to monitor a service check. If that service has stopped you can fire off automation that results in a ticket being generated to the NOC team, or an SMS/email being sent to a support technician. Scripts can also be triggered in the same way where rather than using a notification, a script will attempt to restart the service.
The nice part of the automation feature is that it can be as simple or as complex as you make it, and uses simple workflows to help admins visualize their automation chains.
Who is it recommended for?
Opsview Monitor is the go-to tool for experts that manage Elasticsearch nodes. Its Elasticsearch Opspack is merged with metrics like filesystem, JVM, CPU, and memory into one easy-to-access platform. It has a results exporter feature which sends monitoring data to log servers and various analytics tools. Hence experts can make informed decisions based on the exported data. Opsview Monitor provides a comprehensive solution for monitoring and analyzing Elasticsearch environments.
Pros:
- Flexible Monitoring: Offers a highly flexible monitoring solution that can be tailored to a wide range of environments and requirements.
- Improved IT Performance: Features business service monitoring, allowing organizations to view IT performance in the context of their business services.
- Suits Small and Large Both: Designed with a scalable architecture to support both small and large environments efficiently.
- Robust Integration: Provides strong integration capabilities with IT Service Management (ITSM) tools for improved incident management.
Cons:
- Outdated UI: Some users may find the user interface less intuitive compared to other solutions, potentially impacting the user experience.
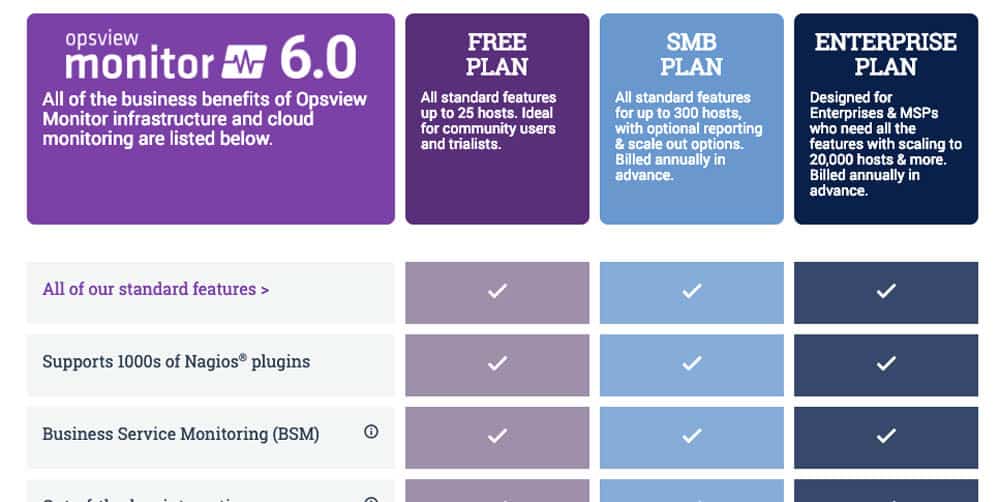
Opsview has three pricing tiers; SMB, Enterprise, and Opsview Cloud. Pricing for SMB starts at $1300 for 50 hosts and is designed for organizations who plan on using less than 300 hosts on-premises.
Its enterprise tier is for organizations who need more than 300 on-premises hosts, while its cloud tier is geared for companies of any size.
You can request a demo of Opsview to try out on your network.
8. ElasticHQ
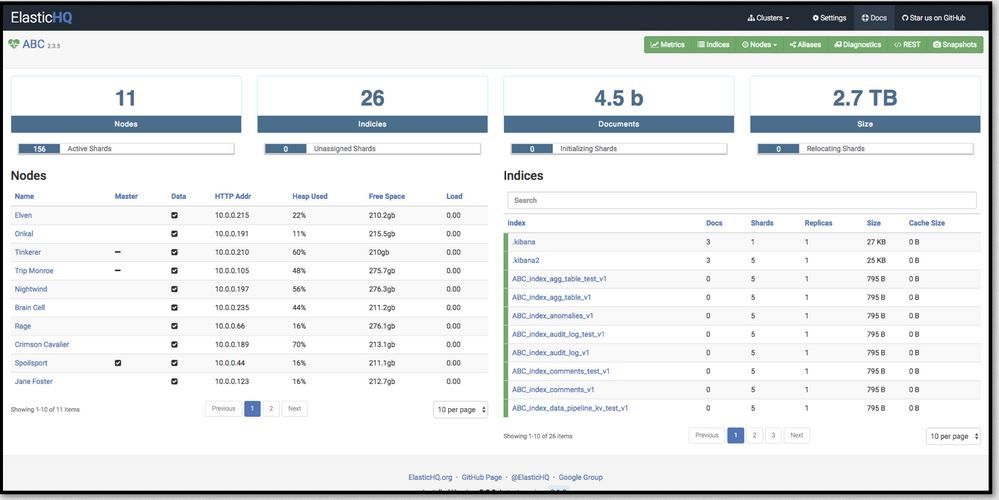
ElasticHQ is an open-source application that features a number of different tools solely focused on monitoring and improving the observability of Elasticsearch. It works by pulling logs, performance metrics, and APM traces together into a single dashboard and using a series of visualizations and troubleshooting tools to gain insight into your engine.
Key Features:
- Elasticsearch Management and Monitoring: Focuses on offering comprehensive operations and observation services for Elasticsearch clusters.
- Real-Time Monitoring: Gives you views of Elasticsearch cluster state, processes’ performance, and data reports.
- Easy-to-Use Interface: Implements a web-based GUI that is accessible for simple control and monitors the clusters of Elasticsearch.
- Query and Index Management: Telling you where and how to manage all your queries and indexing from the interface directly for better performance and stability.
Why do we recommend it?
We highly recommend ElasticHQ because it gives you control over your Elasticsearch clusters, nodes, indexes, and mappings. Through its intuitive UI, you may access all of the features of the Elasticsearch Admin API without having to deal with complicated REST and JSON. Maintaining a smooth Elasticsearch environment is easier and more effective when you use ElasticHQ to manage and watch over your environment.
It features real-time monitoring into each cluster node, revealing configurations, metrics, live threads, and data streams across all of Elasticsearch. ElasticHQ can integrate and run on all major releases and versions of Elasticsearch and frequently tests on all new releases to ensure compatibility.
The platform does an excellent job of helping Elasticsearch admins view their data and insights without having to dig through JSON files or mess with REST requests. Information on nodes, dependencies, mappings, and clusters is automatically translated into simple visualizations that allow admins to view the performance and health of even the largest Elastic nodes at a glance.
The installation of ElasticHQ is straightforward and only takes a few minutes to set up. Once complete, insights can be viewed from any browser, giving you the option to manage or monitor clusters from anywhere with an internet connection.
The installation runs as a standalone component, meaning even if clusters go down or lose connectivity, ElasticHQ will continue to run and is not directly tied to the clusters it monitors. This is a solid option for anyone looking to use an open-source tool for Elasticsearch monitoring but lacks network and infrastructure monitoring capabilities which can leave a blind spot in your monitoring efforts if issues stem from beyond Elasticsearch itself.
Who is it recommended for?
Developers and DevOps specialists who deal with Elasticsearch clusters should consider learning to use ElasticHQ. They can simply manage and keep an eye on every aspect of their clusters, including individual nodes, runtime metrics, and configurations. With capabilities like websocket data streams and real-time threat monitoring, ElasticHQ offers insightful information about how Elasticsearch clusters operate internally. For specialists trying to maximize the effectiveness and performance of their Elasticsearch setups, it's a potent tool.
Pros:
- In-Depth Analysis and Watch Clusters: Created to monitor and closely manage Elasticsearch clusters, providing in-depth analysis data and control over them.
- Open-Source Tool: Features built-in versatility that enables end-users to tweak and expand its functionalities.
- Easy to Operate by Novice Users: Installation and user interface are easy to operate, and because of its user-friendly nature, it can be used by a throng of users who have varying skill levels.
- Instant Metering Job: Monitor Elasticsearch performance and get instant metering job and statistics to resolve the issue before time.
Cons:
- Not Suitable for Broader Infrastructure Monitoring: Unlike most competitors that are capable to cover broader scope of application and infrastructure monitoring functionality, Logz.io relies heavily on its specialization.
There is no official support for ElasticHQ, and much of the support you will find is from the ElasticHQ community. The platform is completely free to use.
9. Paessler PRTG
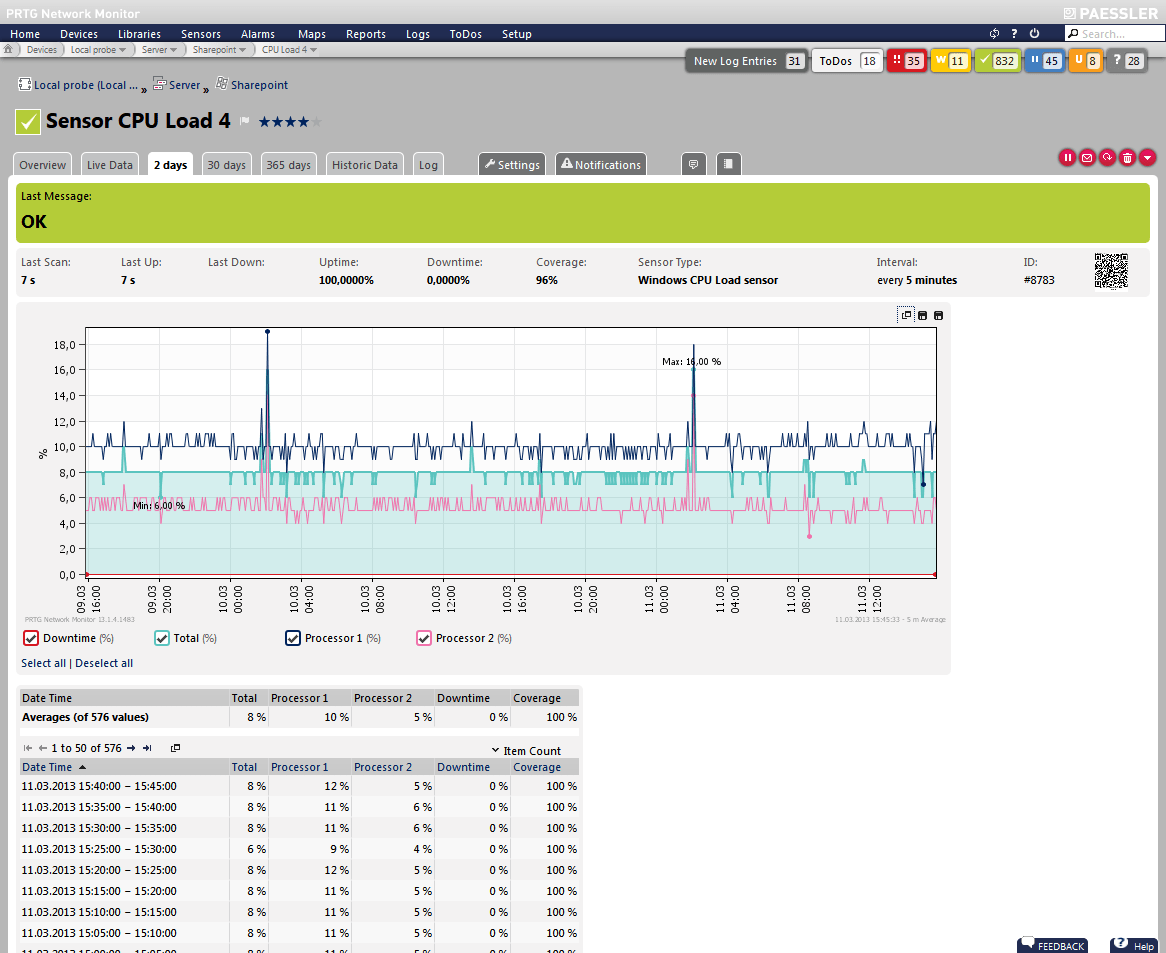
Paessler PRTG offers custom monitors that can be set up to pull metrics from virtually any environment. While there is no dedicated premade sensor for Elasticsearch at this time, we feel PRTG still deserves a mention.
Key Features:
- All-In-One Monitoring: Offers all-in-one monitoring solutions for networks, servers, applications, traffic, and more.
- Custom Sensors: Supports the creation of custom sensors to monitor specific aspects of your infrastructure as needed.
- Flexible Alerting: Provides a wide range of alerting options, including email, SMS, and push notifications, to ensure timely notifications of issues.
- Maps and Dashboards: Includes powerful mapping and dashboard tools to create visual representations of your network and performance data for easy analysis.
Why do we recommend it?
Paessler PRTG is highly recommended as it allows you to monitor all aspects of your network, including devices, traffic, and applications. Automatic network discovery makes setup simple by intelligently locating all devices. Paessler PRTG also automatically creates the appropriate sensors for your devices. It guarantees you can monitor everything you need to maintain your network operating properly by supporting a number of crucial technologies, including Ping, SNMP, WMI, SSH, and HTTP requests.
Small deployable sensors can be set to monitor Elasticsearch logs and pull those events into the PRTG dashboard. That same agent can also be deployed on the supporting infrastructure, server, or container where Elasticsearch operates to provide total visibility across the business.
Since PRTG sensors are so highly customizable, admins can spend a bit of time configuring a sensor for their exact needs, ensuring only the metrics that they want to monitor are captured. This is useful for situations when logs need to be kept for long periods of time, but space is limited.
Who is it recommended for?
It is strongly recommended that network managers use Paessler PRTG. It is created for companies of all sizes, ranging from startups to major corporations, in a variety of sectors. Network professionals rely on Paessler products, which have over 500,000 users globally, to monitor and manage IT, OT, and IoT infrastructures. Whether you're in charge of a large business system or a small office network, Paessler PRTG offers the features and tools required to guarantee optimum performance and dependability.
Pros:
- Range of Sensor Types: Offers a wide range of sensor types for monitoring virtually every aspect of your IT infrastructure.
- Flexible Alerting System: Features a highly flexible alerting system that can be customized to suit different monitoring needs and preferences.
- Web-Based Interface: Intuitive and easy to use, making it accessible for administrators of all levels.
- No Need to Purchase Other Modules: Licensing model includes all features, eliminating the need for additional module purchases.
Cons:
- Trouble in Big Deployments: In large deployments, the system can have significant performance overheads, requiring careful planning and optimization.
Pricing for PRTG is dependent on the number of sensors you deploy. The smallest tier currently offers 500 sensors across one server for $1750.
Which Elasticsearch monitoring tool is right for you?
No matter where your Elasticseach engine lives, or how many clusters you have, SolarWinds Server & Application Performance Monitor has proven itself to be one of the simplest and most reliable ways to monitor not only your Elasticsearch environment but your entire supporting network and infrastructure.
SolarWinds Server & Application Performance Monitor combines simple out-of-the-box monitoring capabilities that ensure there are no blind spots. When performance issues do arise, you’ll know exactly where to start looking to get it resolved.
For those looking for monitoring strictly related to only Elasticsearch, ElasticHQ offers an open-source option of monitoring that is supported by a community forum and a handful of developers.
How do you currently monitor Elasticsearch? Do your monitors cover infrastructure and the network as well? Let us know in the comments below.
Elasticsearch Monitoring Tools FAQs
What are some common metrics to monitor in Elasticsearch?
- Cluster health and status
- Node availability and performance (CPU, memory, disk usage, etc.)
- Indexing and search rates
- Query latency and throughput
- Shard allocation and balancing
What are some tools for Elasticsearch monitoring?
- Elasticsearch's built-in monitoring features (including the monitoring APIs and Kibana dashboards)
- Third-party monitoring tools such as Elastic Stack (formerly known as ELK Stack), Grafana, or Prometheus
- Cloud-based monitoring services such as Amazon CloudWatch, Google Cloud Monitoring, or Microsoft Azure Monitor
How can I set up Elasticsearch monitoring?
You can set up Elasticsearch monitoring using Elasticsearch's built-in monitoring features or a third-party monitoring tool. You will typically need to install and configure monitoring agents on your Elasticsearch nodes, configure monitoring settings in the Elasticsearch configuration file, and set up dashboards or alerts to track performance metrics.
How often should I monitor Elasticsearch?
The frequency of monitoring will depend on the size and complexity of your Elasticsearch cluster and the criticality of the data and services it supports. In general, you should monitor Elasticsearch continuously or at least every few minutes to ensure timely detection of issues.
What are some common issues that Elasticsearch monitoring can help identify?
- Slow or inefficient queries
- High resource usage on individual nodes or across the cluster
- Unbalanced or misconfigured shards
- Network connectivity or firewall issues
- Disk space or memory constraints.
Related Post: Best Network Troubleshooting Software