We may earn a commission if you make a purchase through the links on our website.
The Best HAProxy Monitoring Tools

UPDATED: October 30, 2023
When your HAProxy instances are running hot, it can drastically affect your network infrastructure and web applications. To help you ensure your HAProxy servers are running smoothly, you need to keep track of a wide variety of individual metrics that often aren’t clear-cut in their presentation.
Here is our list of the best tools to monitor the health of HAProxy:
- SolarWinds AppOptics – FREE TRIAL A continuous monitoring application platform with full integration for HAProxy servers. The solution provides a detailed overview of health and performance metrics with a quick setup and installation. Start a 30-day free trial.
- SolarWinds Loggly – FREE TRIAL Another log interpretation utility that can fully integrate alongside SolarWinds AppOptics to combine log data. Start a 30-day free trial.
- ManageEngine Applications Manager – FREE TRIAL HAProxy monitoring integrated suite that can provide live dashboards for back-end and front-end server health status metrics. Start a 30-day free trial.
- Site24x7 – FREE TRIAL Web-based monitoring platform with HAProxy integration that can pull data into easily readable charts and monitoring dashboards. Start a 30-day free trial.
- Datadog Includes full HAProxy integration as part of the installation agent, providing a fast installation and detailed insights into your data metrics.
- Roxy-WI A community-supported GUI interface plugin explicitly designed for load balancing services, giving you more straightforward control and monitoring.
- Logz.io A log analysis service with open-source foundations includes HAProxy integration to interpret log data and present it in a readable format.
- New Relic A free monitoring platform that includes HAProxy services can be enhanced via premium services to include intelligent health and performance monitoring.
To aid in this, you can pull these important metrics from your HAProxy server and display them in a readable format to get a better understanding of the health of your servers. There’s a few methods of doing this.
- Integrated analysis tools and application monitoring utilities pull data externally from your HAProxy server and display them typically through a web interface for better viewing.
- Log readers work similarly, but gather data through your logs and interpret them into usable information.
- GUI plugins are another method of monitoring whereby a visual interface is overlaid onto your HAProxy instances directly, allowing you to interact with them through the GUI and read information live.
This article covers a variety of methods of interpreting your HAProxy health and performance metrics. Of course, you can mix and match these product categories to further expand your monitoring, but generally, you only require one service.
Native HAProxy Health Options
It is feasible to perform health checks without third-party tools manually analyzing log data and pulling health data regarding ports/uri interfaces. However, this solution won’t be suitable for everyone, since it only covers the absolute barebones of health monitoring and doesn’t parse data into readable formats.
You can display health metrics using the ‘mode health’ or ‘monitor-uri’ options, which show your proxy’s general health information. This solution is obviously the cheapest and most readily available since it requires no additional setup. However, the information that can be gleaned from these options isn’t wholly useful for long-term health analysis – hence the need for 3rd party tools.
Our methodology for selecting a HAProxy Monitoring tool:
If you are confused about choosing the best HAProxy Monitoring Tools for your organization, then below we have listed the top-notch methodology to make the right choice.
- Consider metrics coverage, including connections, backend server, and request rates.
- Ensure the tool has a user-friendly interface
- Look for customizable alerts and timely notifications
- Scalability and easy accommodation
- Consider integration and compatibility
- Consider historical data storage and long-time performance
- Costings and security features
- Lookout for customization according to your needs
- Community support and other response
The best tools to monitor the health of HAProxy
1. SolarWinds AppOptics – FREE TRIAL
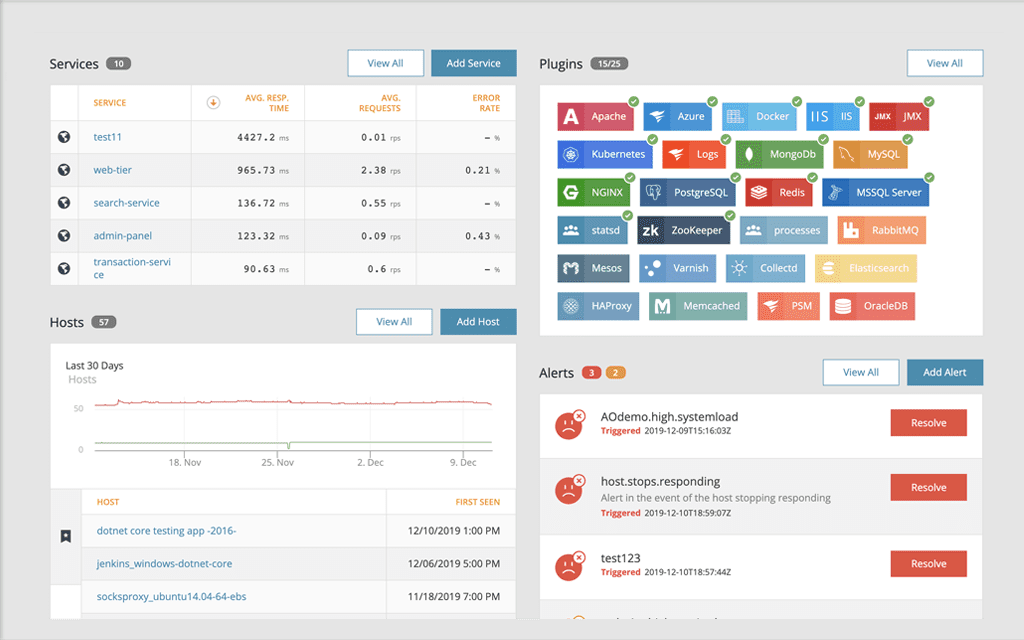
SolarWinds AppOptics is a continuous application monitoring platform that includes an integration plugin for HAProxy health and performance monitoring. The solution can provide deep insights into your errors and server down periods to enhance your troubleshooting capabilities.
Key Features
- Integration plugin for HAProxy
- Wide variety of monitoring metrics
- Full-stack app monitoring
- Customizable or Pre-set dashboards
- SolarWinds Loggly integration
Why do we recommend it?
SolarWinds AppOptics offers detailed insights into errors and server downtimes, hence making troubleshooting easier. This tool stands out with customizable or pre-set dashboards, providing a user-friendly interface tailored to meet specific monitoring needs with ease.
AppOptics includes a customizable dashboard for consistent monitoring and has parameters for more than 80 HAProxy specific metrics to enhance your observability significantly. SolarWinds also present several preset dashboards to reduce fiddly setup requirements and get you monitoring your HAProxy health metrics quickly.
Another solution on this list is SolarWinds Loggly. If you choose to do so, you can set up combined integrations between these two solutions to massively enhance your monitoring ability. This allows you to easily aggregate and compare both log and performance metrics to determine the cause of health risks and pinpoint precise timings for better load-balancing demands.
Who is it recommended for?
SolarWinds AppOptics is widely used by DevOps professionals, IT administrators, and application performance monitoring (APM) specialists. Other than this, individuals responsible for managing and optimizing auto-instrumented application services utilize this tool to pinpoint the root cause of performance issues.
Pros:
- Offers great visualizations reflecting live and historical health metrics and resource consumption
- Is an easily scalable cloud service
- Tracks all major resources focusing on over 180 different metrics
- Can monitor Docker, Azure, and Hyper-V platforms, offering more flexibility than competing options
Cons:
- Would like to see a longer trial period
SolarWinds AppOpticts has a full 30-day free trial available on the website. SolarWinds distribute the AppOptics solution by dividing it into Infrastructure Monitoring and Application Monitoring and selling it in ‘packs’ of 10 hosts and 100 containers.
For just the Infrastructure Monitoring solution, it costs around $10 per host per month. Including the Application Monitoring package that increases the cost to $25 per host per month.
EDITOR'S CHOICE
SolarWinds AppOptics is the foremost choice for APM and infrastructure monitoring due to its SaaS-based model and its suitability for hybrid and cloud-native IT environments. It has excellent troubleshooting capabilities which includes triple threat distributed tracing, live code profiling, and exception tracking. This allows quick identification and resolves performance issues for modern IT infrastructures.
Download: Download a 30-Day Free Trial
Official Site: https://www.solarwinds.com/appoptics
OS: Windows Server
2. SolarWinds Loggly – FREE TRIAL
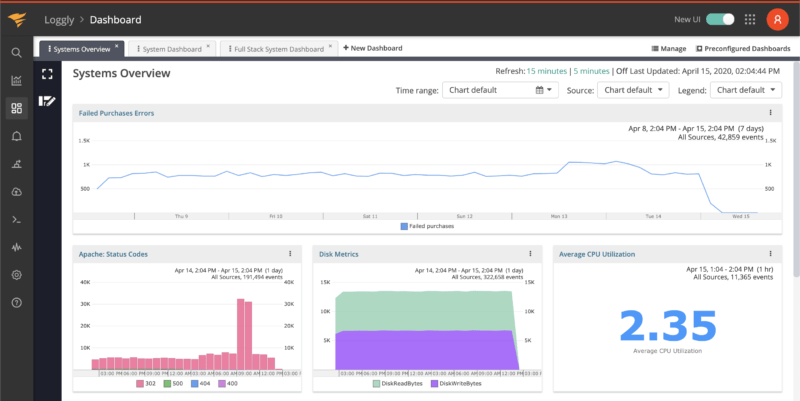
SolarWinds Loggly is a log parsing and analysis product that can integrate with your HAProxy instances to pull log data using a Syslog daemon. While the setup can be pretty involved and requires several specific installation parameters to be put in place to work alongside Loggly, once designed the solution integrates and works alongside your HAProxy servers smoothly.
Key Features
- APM integrated log analysis
- Customizable dashboard
- Scalable full-stack log management
- Automated log summaries
- Longer setup requirements
Why do we recommend it?
SolarWinds Loggly tool is easy to use and gives rapid results. The tool automatically indexes logs, enabling fast searches. It is best in rapid troubleshooting by efficiently tracing issues to their root cause through correlations, interactions, and relationship insights.
The service provides a means of checking health and performance metrics through log data but primarily focuses on performance monitoring via its APM systems. For extended monitoring, it can integrate with SolarWinds AppOpticts for alerting systems and a better overview of your server health.
Who is it recommended for?
The IT Operations Managers, System Administrators, and DevOps Engineers love to use this amazing tool – SolarWinds Loggly. It helps to leverage the tool's continuous performance monitoring to eliminate issues proactively, ensuring a seamless user experience and preventing service interruptions.
Pros:
- Lives in the cloud, allowing syslogs servers to scale regardless of onsite infrastructure
- Setup is easy, no lengthy onboarding process
- Can pull logs from cloud platforms such as AWS, Docker, etc
- Data is immediately available for review and analysis
- Offers a completely free version with limited retention
Cons:
- Would like to see a longer 30-day trial
The log management and analytics solution are available as a SolarWinds APM Integrated Experience component for $79 per month. A 30-day free trial of all known components is also available.
You might want to consider adding extra features to your purchase, such as Real User Monitoring or Infrastructure monitoring, which work in tandem with the Loggly component.
3. ManageEngine Applications Manager – FREE TRIAL
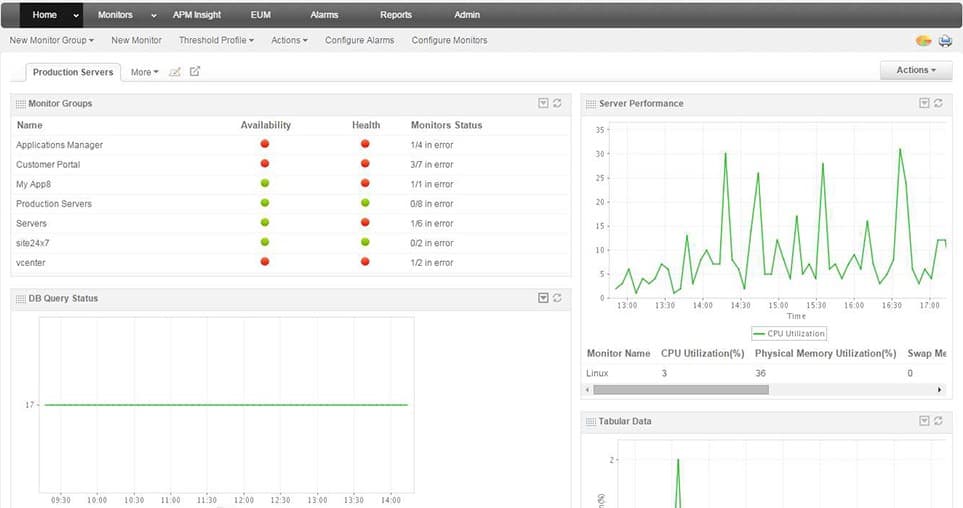
ManageEngine Applications Manager features a full integration suite for HAProxy that will allow you to view complete performance data and track HAProxy capacity information. In addition, the monitoring tool can pull frontend data such as client connections and check overall user interactions.
Key Features
- Health metric aggregation
- Alarms for health risks
- Customizable dashboards
- Hotspot detection
- Smooth integration
Why do we recommend it?
ManageEngine Applications Manager is well-known for its diverse service offerings. From monitoring HAProxy performance metrics to integrating ticket systems for issue tracking, it provides comprehensive solutions. Additionally, the tool streamlines automatic patch management, enhancing overall system efficiency and reliability.
The customizable dashboards can drastically simplify health monitoring by correlating your frontend and backend metrics and identify hotspots. You can also configure alarms to notify you whenever the health of your HAProxy servers is at risk.
Who is it recommended for?
ManageEngine Applications Manager is recommended for System Administrators, Network Administrators, and HAProxy specialists. It has a comprehensive metrics collection to achieve high visibility into HAProxy's performance, simplifying monitoring and ensuring effective management of the HAProxy infrastructure.
Pros:
- Offers on-premise and cloud deployment options, giving companies more choices for install
- Can highlight interdependencies between applications to map out how performance issues can impact businesses operations
- Offers log monitoring to track metrics like memory usage, disk IO, and cache status, providing a holistic view into your database health
- Can automatically detect databases, server hardware, and devices for real-time asset management
Cons:
- Can take time to fully explore all features and options available
ManageEngine Applications Manager has a free version available to download from the website to support up to 5 apps or servers monitored. There is also a free trial available for the Professional and Enterprise versions of the service.
The Professional version costs $395 per year for ten individual service monitors, or you can buy a perpetual license for $795. The cost of the Professional version scales with the number of monitors up to a maximum of 250. The Enterprise version, which starts at $9,595 per year for 250 monitors, scales past upwards.
4. Site24x7 – FREE TRIAL
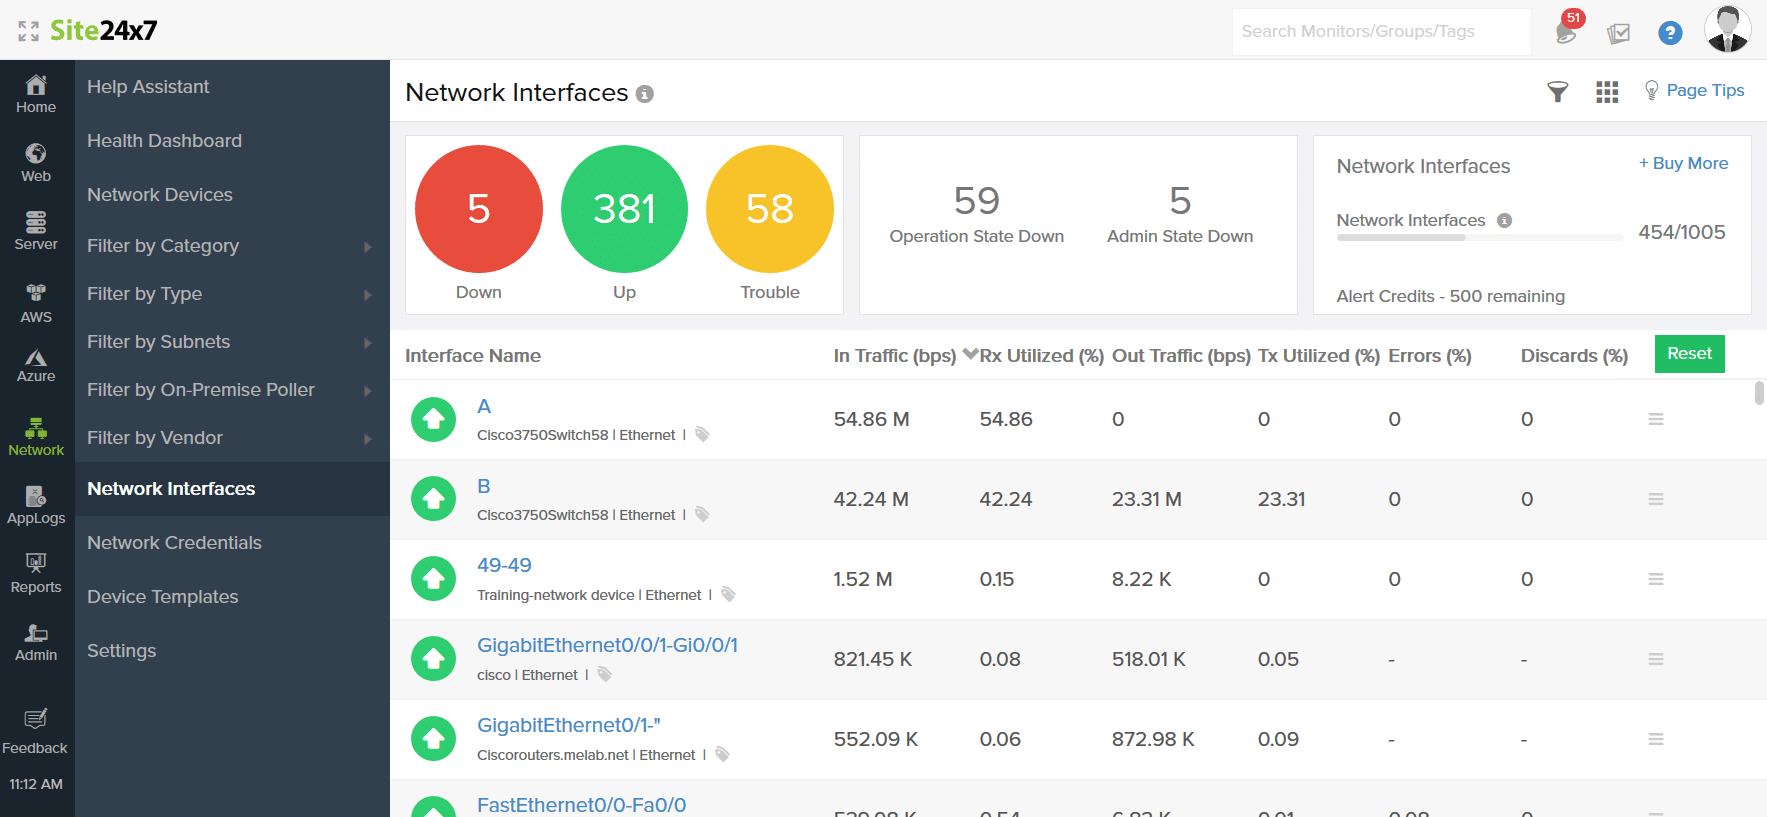
Site24x7 provides a web-based monitoring service with a HAProxy plugin that means integration is very straightforward. The platform can monitor all standard metrics from the HAProxy servers and aggregate the health and performance monitoring data.
Key Features
- Python plugin for easy integration
- Performance and health metric aggregation
- Monitoring dashboards
- Service and process monitoring
- Flexible pricing
Why do we recommend it?
Site24x7 performs efficient monitoring of HAProxy, ensuring optimal performance and high availability. The best thing is it is free and open-source software and contains a robust load balancer and proxy server for TCP and HTTP applications.
The request errors, frontend, and backend metrics can be aggregated and compared for a complete overview of the server’s health. In addition, site24x7 has a flexible scaling pricing model meaning you can precisely customize your service demands.
Who is it recommended for?
Site24x7 is recommended for IT Operations Managers, System Administrators, and DevOps Engineers. These professionals can benefit from the tool's capability to set alerts on various metrics and receive notifications through channels like email and PagerDuty, ensuring timely responses to potential issues for efficient system management.
Pros:
- One of the most holistic monitoring tools available, supporting networks, infrastructure, and real user monitoring in a single platform
- Uses real-time data to discover devices and build charts, network maps, and inventory reports
- The platform is intuitive, little training is needed to get it fully functional
- User monitoring can help bridge the gap between technical issues, user behavior, and business metrics
- Supports a freeware version
Cons:
- Is a very detailed platform that will require time to fully learn all of its features and options
The Infrastructure Monitoring package has an essential cost of $10 per month for ten monitored servers/websites/cloud instances. You can add additional examples in sets of 10, 50, and 500 to determine your exact service requirements.
Site24x7 also offers a 30-day free trial that can help you familiarise yourself with the HAProxy health monitoring capabilities of the platform.
5. Datadog
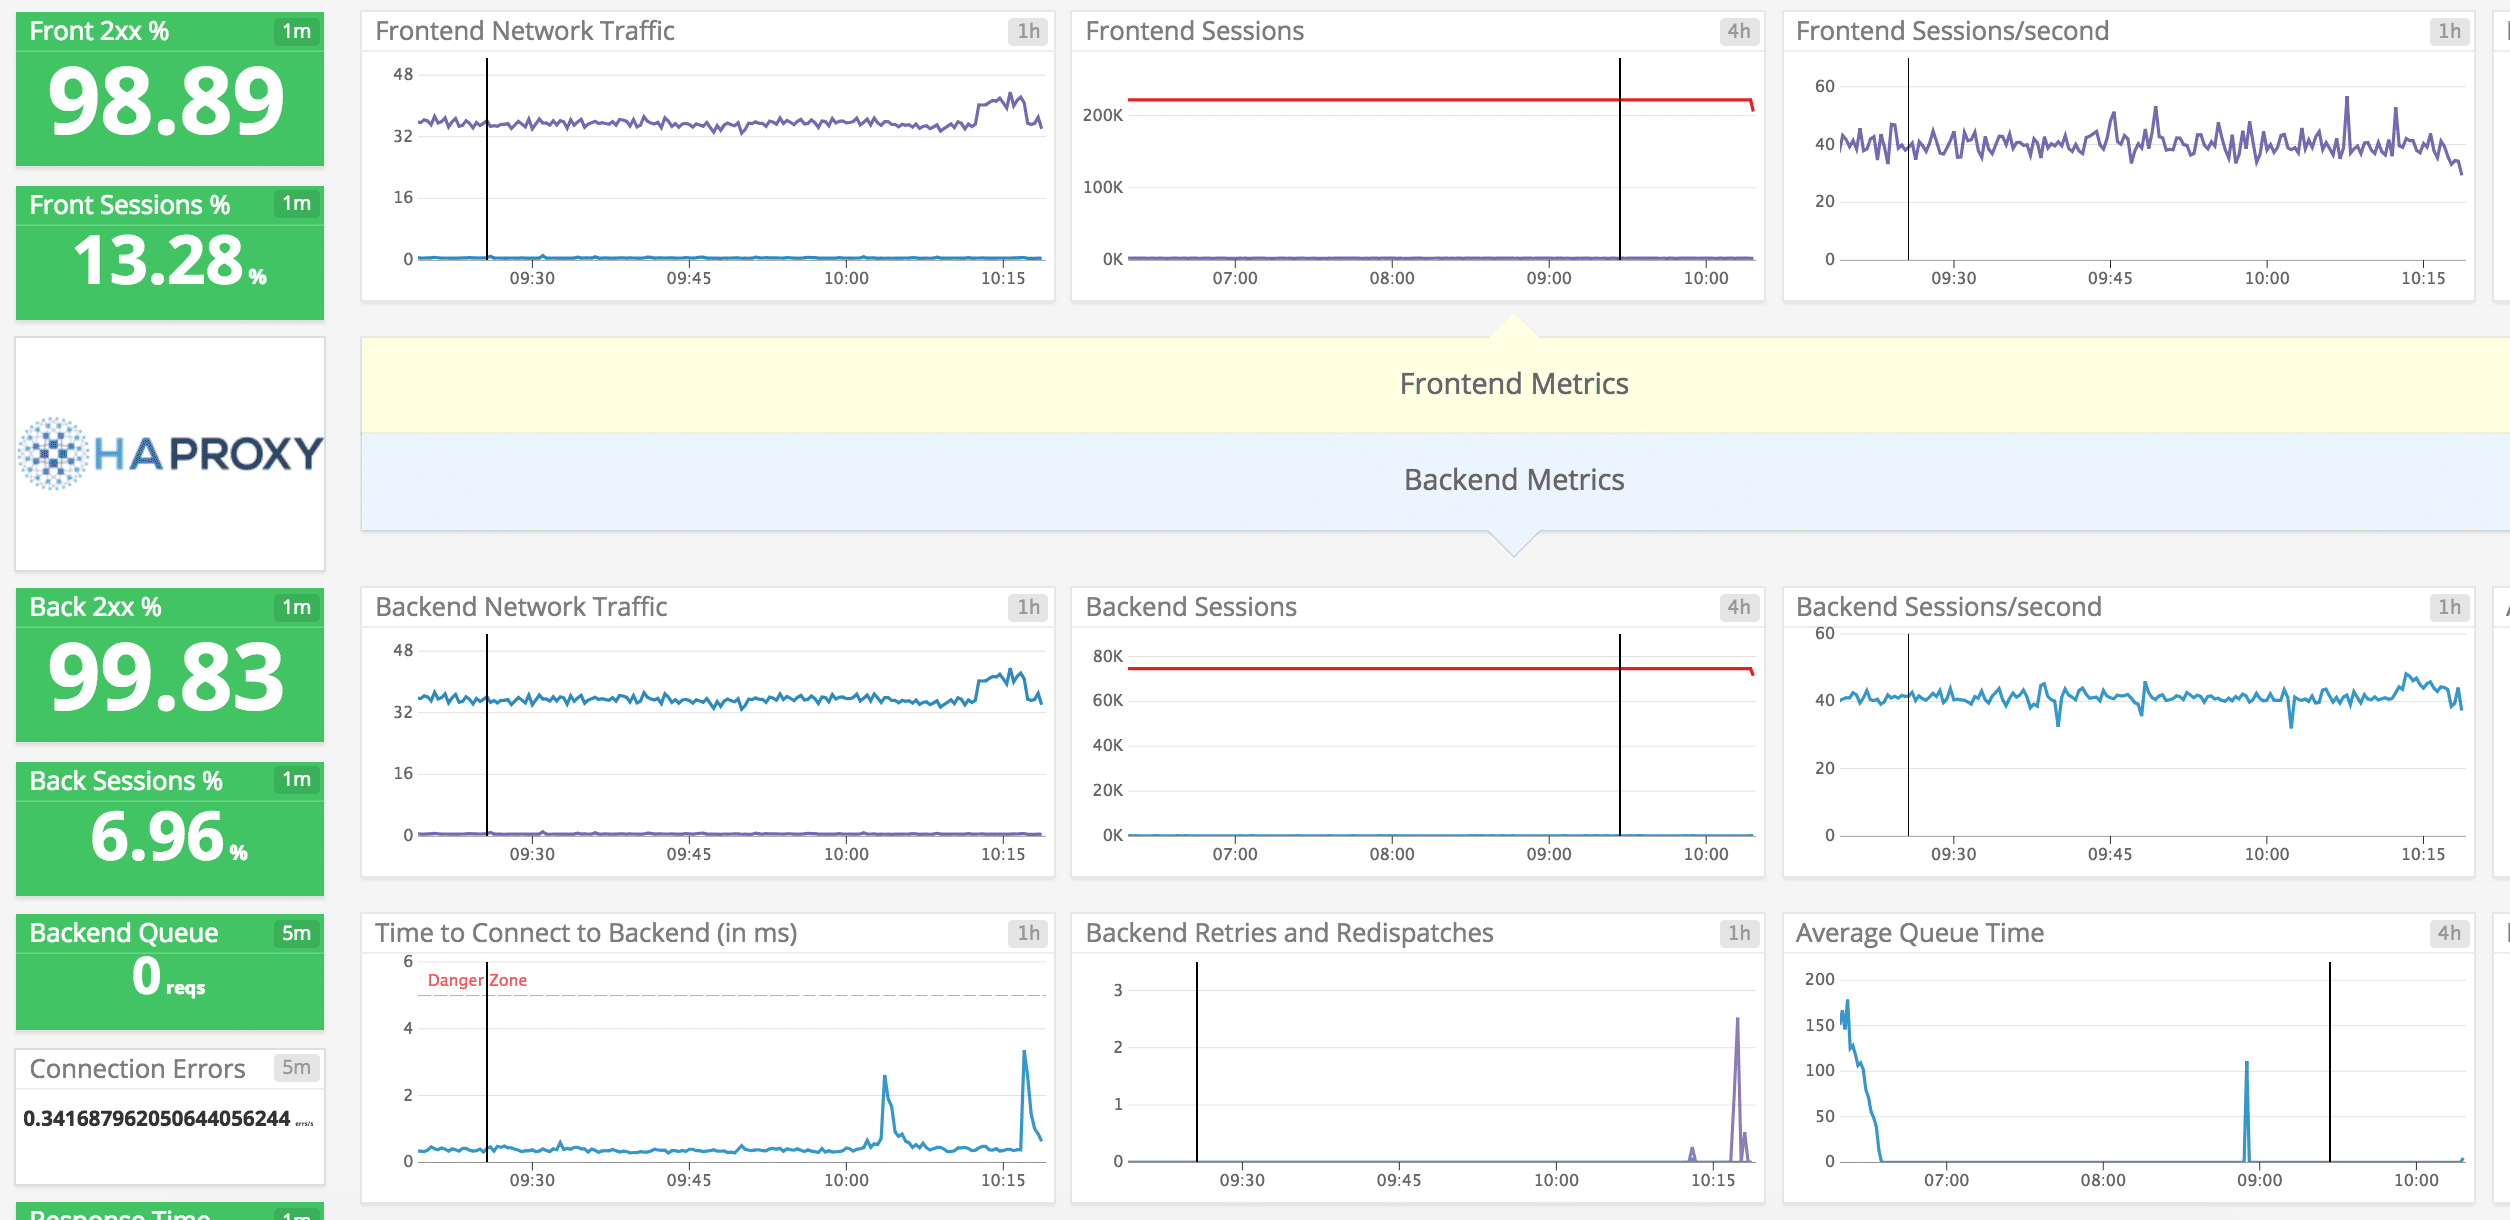
Datadog includes a HAProxy package within the installation agent, meaning there’s not much work required to integrate it to monitor your HAProxy servers fully. In addition, the solution offers fully customizable dashboards that can help you track your front-end and back-end traffic data.
Key Features
- Fast installation & integration
- Customizable dashboards
- Health and performance data correlations
- Down notifications
- Balancing with other integrations
Why do we recommend it?
Datadog is a cloud-based SaaS model which eliminates the need for server deployment and onboarding costs. It can monitor both internal and external metrics to get a comprehensive view of network performance and accessibility. Hence, it is an efficient and cost-effective choice for holistic monitoring.
Set boundaries and alerting systems to ensure you stay on top of the health of your HAProxy servers. By integrating other services into Datadog, you can also use the performance metrics to correlate and balance your HAProxy server with other servers and applications.
Who is it recommended for?
Datadog is recommended for IT Operations Managers, System Administrators, and DevOps Engineers. These professionals can use Datadog tools to monitor HAProxy deployments across various environments, including Kubernetes, Amazon ECS, physical hosts, or Docker.
Pros:
- Great interface, easy to use, and highly customizable
- Cloud-based SaaS product allows monitoring with no server deployments or onboarding costs
- Can monitor both internally and externally giving network admins a holistic view of network performance and accessibility
- Supports auto-discovery that builds network topology maps on the fly
- Prebuilt widgets allows users to create detailed dataflows in just a few clicks
- Allows businesses to scale their monitoring efforts reliably through flexible pricing options
Cons:
- Would like to see a longer trial period for testing
Datadog offers a full 14-day free trial that can be used to test out the HAProxy integration and see how well it fits into your infrastructure. The free version provides the basic features, but you’ll need the Pro version at minimum for the HAProxy integration, which costs $15 per month per host.
The Enterprise version can expand on the capabilities of the Pro version by adding data forecasting, allowing you to predict and AI-driven alerting, which may be helpful depending on the scale of your infrastructure and HAProxy server demands.
6. Roxy-WI
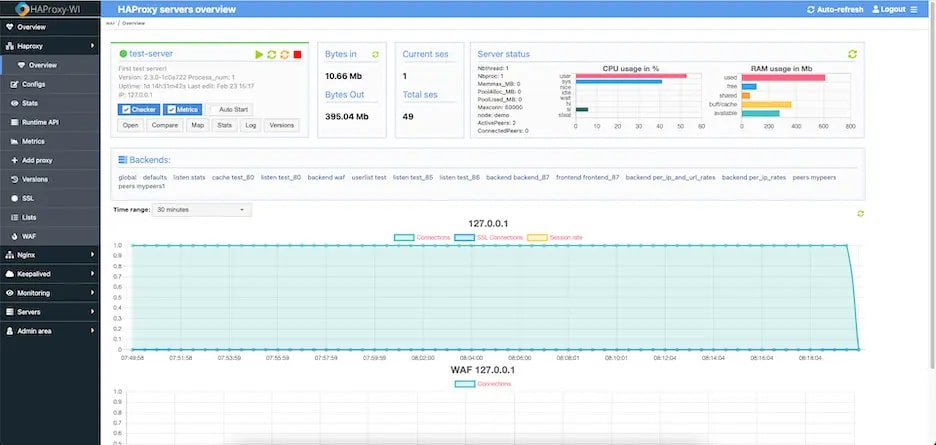
Roxy-WI is a simple GUI integration plugin for HAProxy that allows you to easily monitor performance and health metrics pulled directly from your server infrastructure. Unlike other options on this list, Roxy-WI was explicitly built for load balancing with HAProxy interfaces now in mind.
Key Features
- Proxy monitoring GUI
- Alerting systems
- Security features
- Direct configuration through GUI
- Community-supported
Why do we recommend it?
Roxy-WI helps to monitor both backend and frontend performance, enabling efficient detection of server health issues. The overlaid GUI allows direct interaction with HAProxy servers, allowing users to perform tasks as if working on the server itself, enhancing ease of use and real-time management.
The solution allows you to monitor both backend and frontend performance data and detect health issues on your servers. In addition, you can fully interact with your HAProxy servers directly through the overlaid GUI and perform tasks as if working on the server itself. The project itself is community-supported and is funded primarily through a Patreon subscription service.
Who is it recommended for?
Roxy-WI helps System Administrators and HAProxy configuration specialists to quickly create configurations with error checks, ensuring seamless deployment without loading configurations containing errors.
Pros:
- Designed specifically for load balancing and sysadmin management
- Simple and customizable admin dashboard
- Great GUI alternative
- Completely free
Cons:
- Free version lacks features some may find essential
The primary manually installed interface is completely free but doesn’t include many of the essential features you will require for proper health monitoring. You can receive additional benefits by contacting the company directly or subscribing to the services via Patreon.
The Home basic plan adds the essential monitoring services and costs around $7 per month. The Enterprise plan is designed specifically for corporate use while including additional support directly from the company and costs $21 per month. Finally, the Cloud package moves the interfacing options and setup now to the cloud hosting platform and includes all of the features of the Enterprise plan, and costs around $30 per month.
7. Logz.io
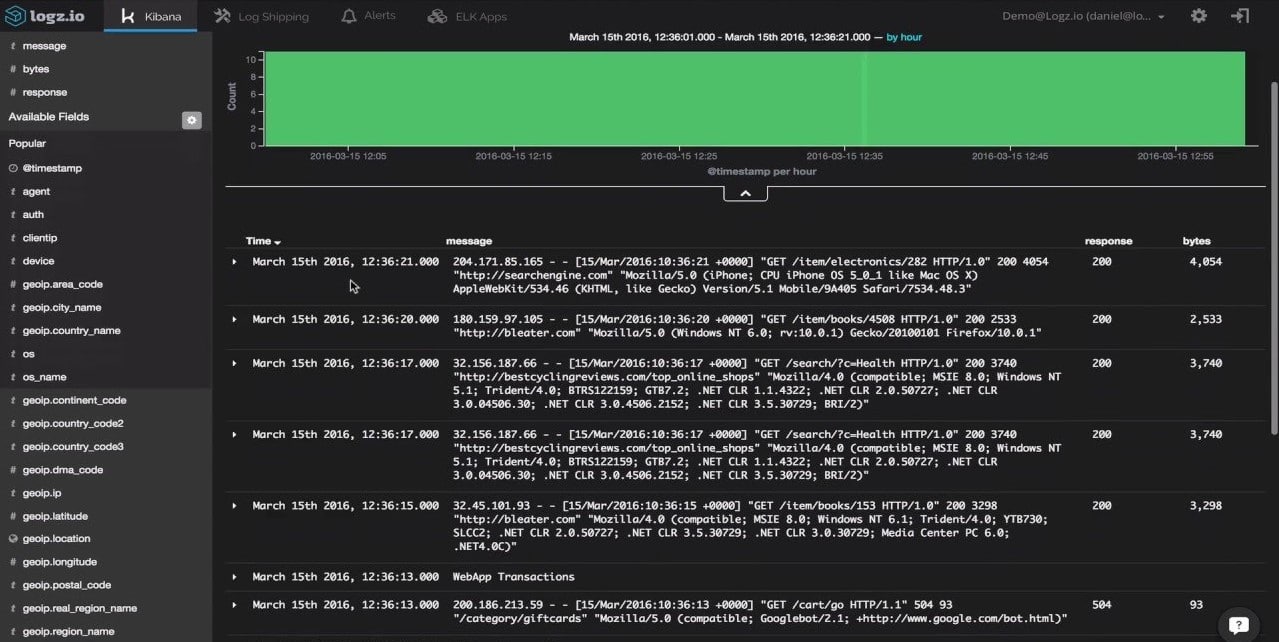
Logz.io is a professional service based on multiple open-source monitoring systems that have been aggregated and combined into a single, unified platform. By combining this solution with an ELK Stack setup, you can pull log data into Logz.io to utilize all of the dashboarding and monitoring features that the service provides.
Key Features
- Open-source foundations
- Central data monitoring
- Automatic error detection
- Anomaly alerting
- Longer setup requirements
Why do we recommend it?
Logz.io offers the easiest way to achieve observability, providing swift data analysis for accelerated troubleshooting. It has user-friendly features and powerful analytics, which is perfect for robust log management and analysis solutions. It works on a cloud platform which allows easy access and to monitor growth.
While this means the setup and installation are much longer than other options, you can transform your HAProxy server log data into usable health and performance metrics. You can also take advantage of Logz.io’s other features, including the excellent search and filtering tools and pattern detection utilities.
Who is it recommended for?
Logz.io is used by IT Operations Managers and System Administrators. It allows experts to have proper log management and has great analysis capabilities to enhance observability and streamline troubleshooting processes for improved system performance and reliability.
Pros:
- Operates in the cloud, allowing for flexible and predictable growth for monitoring
- Leverages threat intelligence data from both public and private sources
- Flexible alerting integrations allow you to easily alert team members or forward issues to ticketing solutions
Cons:
- The 40-day retention period can be a large drawback when investigating past events
- Needs more documentation and KB articles for integrations
- Search functionality can be made more user-friendly
Logz.io includes a free Community version with 1-day log retention and 1GB of log data indexing. A free trial of the Pro edition is also available on the website.
The Pro version is paid dependent on the duration of log retention needed, with the cheapest option costing $0.98 per GB of indexed data. Finally, an Enterprise solution improves the software's security features and available capacity, but you'll have to contact them directly for a quote.
8. New Relic
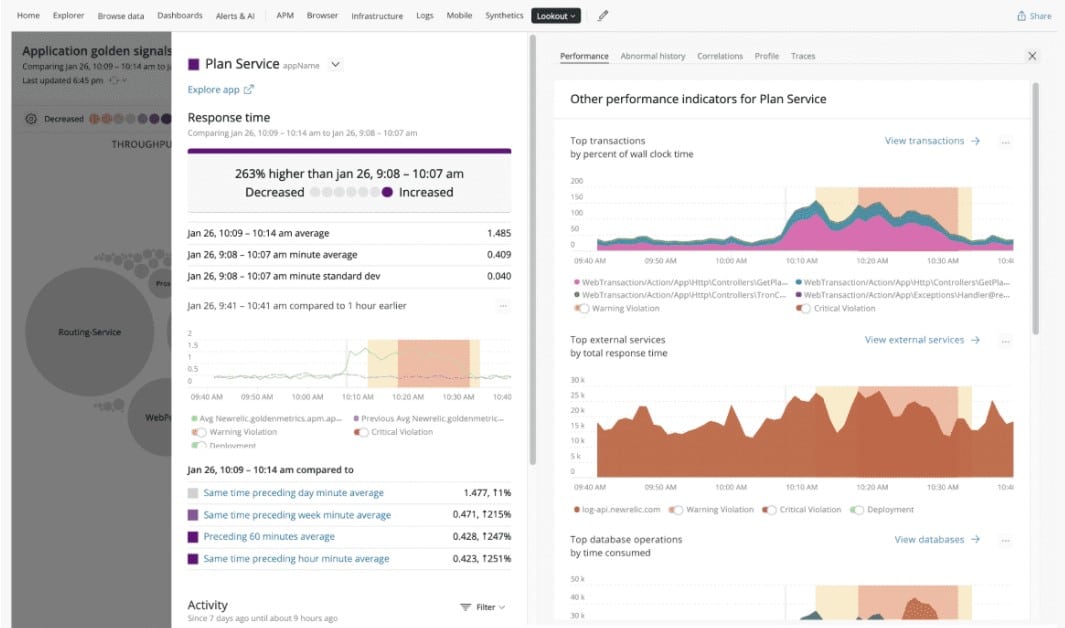
New Relic provides a free alternative for HAProxy health monitoring, with potential upgrades to premium and enterprise-grade versions depending on your monitoring and scalability requirements. By installing the infrastructure agent or integrating with Kubernetes/Amazon ECS, you can set up total health and performance metric monitoring.
Key Features
- Variable pricing model
- Monitoring alerts
- Metric labeling
- Front and Backend metric comparisons
- Customizable dashboards
Why do we recommend it?
New Relic is a great option as it offers customizable dashboard features and alerting tools. The ability to add custom labels to metrics facilitates improved filtering and data querying, making it a robust choice for organizations seeking comprehensive monitoring and alerting capabilities.
New Relic provides a suite of customizable dashboarding features and alerting tools for better health awareness. You can also append custom labels to metrics for better filtering and data querying.
Who is it recommended for?
New Relic is recommended for Web Operations Managers and Site Reliability Engineers (SREs). These professionals, especially those managing high-traffic websites and services, can use New Relic's features to achieve better uptime and optimize the performance of their online platforms.
Pros:
- Focused on providing AIOps for websites and mobile apps
- Can identity and alert to SSL, JavaScript, load times, and browser issues
- Ideal for high-traffic websites and services – great for getting better uptime
- Offers a completely free tier
Cons:
- Available only as a cloud service
For a single user, New Relic is free for up to 100GB of data per month. The Standard version allows for five users, while the Pro version enables many full-access users. You'll need to contact New Relic's sales team for a personalized quotation on price.
In Summary
This article covers nine of the best tools that you need to monitor the health of your HAProxy servers. Regardless of your chosen solution, the main thing is that your data will be displayed in a readable format. Generally, all of the solutions listed also include a notification system to warn you of health risks.
If you’re on a budget, you may consider solutions such as Roxy-WI or New Relic to provide the functionality you need while keeping costs relatively low. You may also choose a log reading solution such as SolarWinds Loggly or Logz.io to interpret your HAProxy logs and turn them into usable data.
SolarWinds AppOptics, Datadog, and ManageEngine Applications Manager provide substantial functionality as integrated analysis tools and application monitoring utilities for premium grade demands.
