We may earn a commission if you make a purchase through the links on our website.
The Best IBM Db2 Monitoring Tools
UPDATED: September 10, 2025
Looking to keep tabs on your Db2 ecosystem? In this article, we’ll explore 9 of the best IBM Db2 monitoring platforms you can use to monitor all Db2 products in one single place.
Here is our list of the best IBM Db2 Monitoring Tools:
- Site24x7 Db2 Monitoring – EDITOR'S CHOICE Offers flexible add-ons for cloud-based monitoring that are ideal for smaller businesses looking to grow their monitoring capabilities soon. Start a 30-day free trial.
- ManageEngine Applications Manager – FREE TRIAL A powerful solution that provides end-to-end visibility across applications and databases in real-time with proactive insights and updates. Download a 30-day free trial.
- Paessler PRTG – FREE TRIAL Customizable sensor that allows companies to have granular control over every metric that is monitored.
- Datadog Uses out-of-the-box reporting, monitors, and reports to allow for fast and cloud-based monitoring.
- Idera Pairs database optimization tools with a heavily DBA-focused monitoring backend.
- SolarWinds Server & Application Monitor Features a flexible way to monitor Db2 databases as well as their supporting infrastructure on a single platform.
- AppDynamics Utilizes clean and intuitive dashboard to provide both Db2 insights as well as business intelligence.
- Opsview Features simple integrations using preconfigure Opspacks that contain premade sensors, reports, and alerts
- IBM Db2 Data Management Console A free tool included with Db2 deployments that offers great visibility into Db2, but cannot monitor other aspects of network infrastructure.
Our methodology for selecting the Best IBM Db2 monitoring tools:
We've broken down our analysis for you based on these key criteria:
- Performance Monitoring: Tools should provide real-time performance insights and metrics.
- Ease of Use: The interface should be user-friendly and intuitive.
- Scalability: Tools must handle different database sizes and environments.
- Integration: Compatibility with other systems and databases is crucial.
- Support and Documentation: Strong customer support and comprehensive documentation are essential.
The Best IBM Db2 monitoring tools
1. Site24x7 Db2 Monitoring – FREE TRIAL
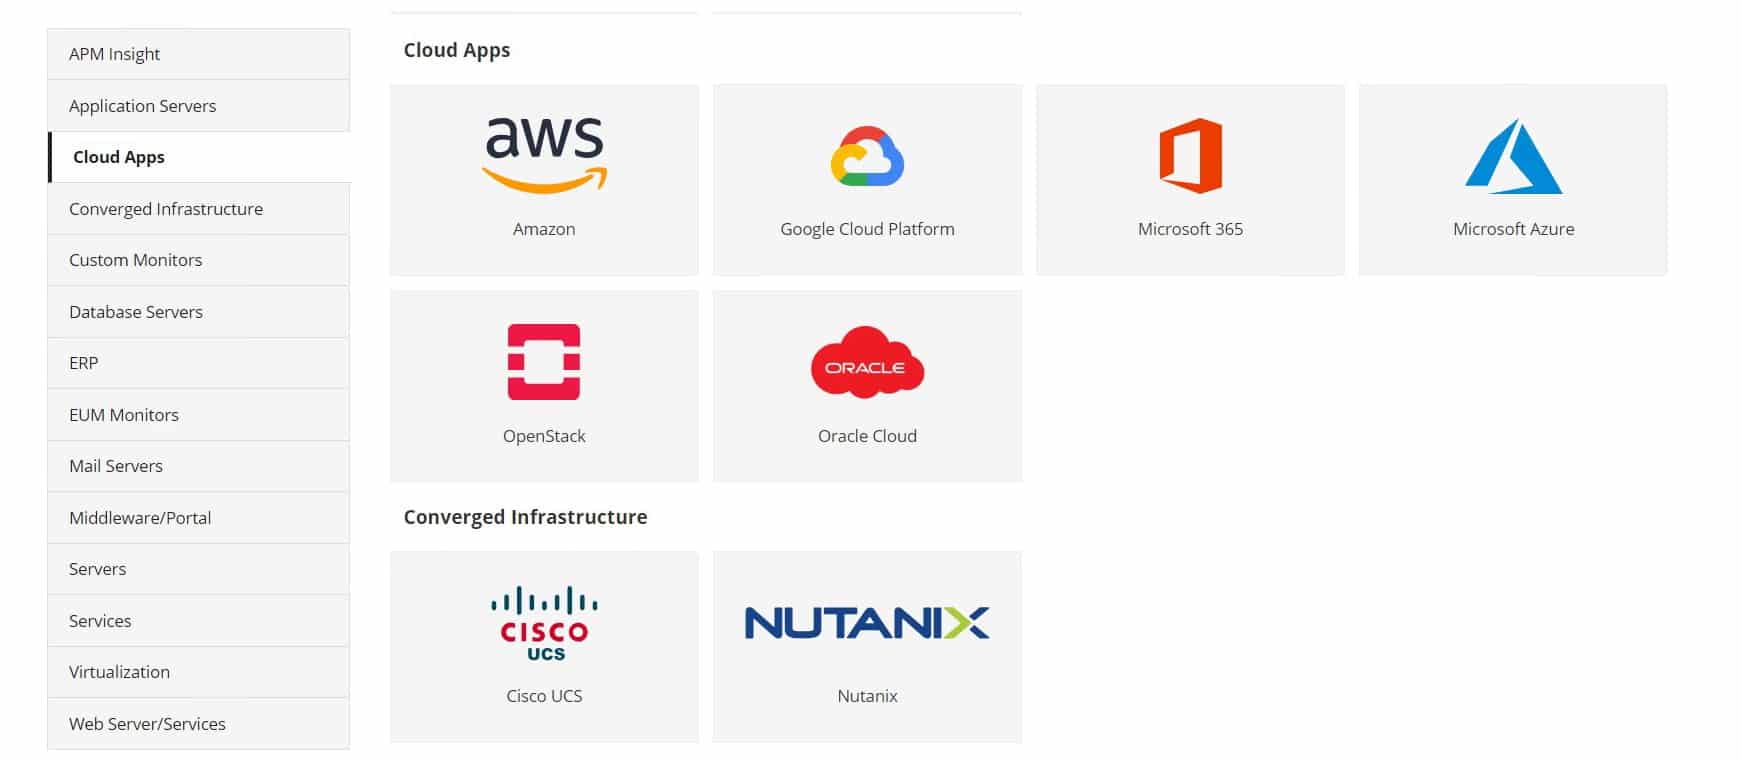
Site24x7 is another cloud-based monitoring tool that offers a suite of monitoring agents that can report on the performance and health of servers, networks, and individual applications. Site24x7 uses plugins on its base monitoring agents to integrate into different environments such as Db2.
Key Features:
- Modular Add-Ons: Site24x7 offers modular add-ons, allowing users to customize monitoring solutions according to their specific requirements, enhancing flexibility and scalability.
- Application, Network, and Infrastructure Monitoring: With comprehensive monitoring capabilities across applications, networks, and infrastructure, Site24x7 ensures holistic visibility into Db2 environments.
- Flexible Integrations: Supports flexible integrations, enabling seamless integration into different environments and systems, including Db2, enhancing interoperability and data exchange.
Why do we recommend it?
Site24x7's Db2 Monitoring stands out as a cloud-based solution offering a comprehensive suite of monitoring agents tailored to monitor server, network, and application performance. Our recommendation is based on thorough testing, affirming Site24x7's ability to provide real-time insights into Db2 environments while offering tools for analyzing performance trends over time. With its modular add-ons and flexible integrations, Site24x7 simplifies Db2 monitoring, making it an ideal choice for organizations seeking efficient performance management.
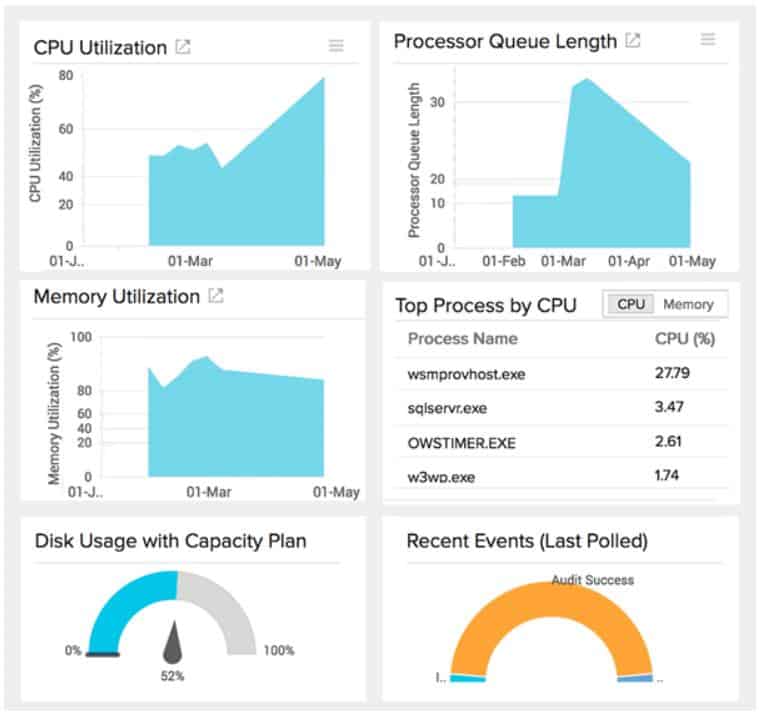
The platform does a great job of monitoring both real-time metrics, as well as providing tools that allow DBAs to look at big picture performance trends and metrics over time. This can prove especially useful when making changes across databases and needing to correlate internal changes with swings in performance.
Metrics like a number of buffer pools, logic/physical reads, and hit ratio are all captured in detail and then reported back to a home dashboard for visualization, analysis, and comparison. Once metrics are in place to be monitored, an incredibly simple alert template can be used to tie events to specific actions.
By following the alert creation wizard you can ensure that the right people are getting notified when performance starts to drift too far in the wrong direction, or if specific conditions or thresholds are met. Alert notifications can be sent out via SMS, email, third-party platforms like Slack, or custom solutions via a webhook integration.
Pricing for the Site24x7 APM plan starts at $35 per month when billed annually and includes 500MB of log files, as well as the monitoring of up to three applications. Add-ons are all customizable, meaning you can mix and match different log management options with your own unique number of monitor add-ons.
Who is it recommended for?
Site24x7 Db2 Monitoring is recommended for IT professionals and organizations requiring robust monitoring solutions for Db2 environments. From small businesses to large enterprises, Site24x7 caters to diverse needs, offering scalability and flexibility in monitoring server, network, and application performance. Additionally, organizations seeking cloud-based monitoring solutions with intuitive interfaces and customizable features will find Site24x7 Db2 Monitoring invaluable for optimizing Db2 performance and ensuring system reliability.
Pros:
- Out-of-the-Box Templates for Quick Apache Server Monitoring: Site24x7 provides pre-built templates for monitoring Apache servers, facilitating quick setup and deployment with minimal configuration.
- Real-Time Data Discovery and Visualization: The platform utilizes real-time data to discover devices and generate charts, network maps, and inventory reports, enhancing visibility and analysis capabilities.
- Intuitive Platform with Minimal Training Requirements: Site24x7 offers an intuitive interface, requiring little training to become fully functional, enabling users to maximize productivity and efficiency.
- Supports Freeware Version: Site24x7 offers a freeware version, making it an excellent option for smaller networks or organizations with budget constraints.
Cons:
- Detailed Platform Requiring Time to Learn All Features: While Site24x7 offers extensive features and options, its detailed nature may necessitate time for users to fully explore and utilize all functionalities effectively.
You can try Site24x7 completely free through a 30-day trial.
2. ManageEngine Applications Manager – FREE TRIAL
ManageEngine Applications Manager is a powerful solution for monitoring different types of databases, all from one centralized platform. IT teams or businesses that prefer a solution guaranteeing real-time visibility and detailed updates on crucial performance metrics must go with this tool. Further, it allows team members to anticipate potential issues and prevent unexpected downtime.
Key Features:
- Comprehensive visibility: Allows monitoring critical indicators like resource utilization, cluster availability, query performance, and session activity in real time to quickly identify bottlenecks.
- Root cause analysis: Helps team members figure out problem areas and resolve performance issues before they impact end users.
- Forecasting capabilities: Leverage machine learning–driven forecasting reports to predict future database usage and capacity needs.
Why do we recommend it?
ManageEngine Applications Manager is one of our main recommendations because it is capable of handling several databases and infrastructure components. Unlike traditional monitoring tools that only track availability, this platform goes further by providing real-time insights into query performance, resource consumption, and cluster behavior.
The tool is easy to deploy and has customizable dashboards with a detailed reporting feature, giving teams visibility into performance metrics without requiring advanced coding or complex setup.
Who is it recommended for?
IT operations teams, system administrators, and DBAs managing databases in hybrid or distributed environments might find it a perfect option. It is particularly valuable for organizations that want one tool to monitor multiple systems.
Pros:
- Technology Support: Offers support to 150+ technologies for monitoring applications, databases, and services.
- Agentless Monitoring: Eliminates the overhead of installing and managing agents across servers.
- Root Cause Analysis: Quickly identify anomalies and performance bottlenecks before they affect end users.
- ML-Powered Forecasting: Predict resource utilization and usage trends with AI-driven insights.
Cons:
- Learning Curve: The wide range of features can be overwhelming for new users.
Download a 30-day free trial.
3. Paessler PRTG – FREE TRIAL
Paessler PRTG features a host of customizable and premade sensors that can monitor almost all aspects of a company's network, server resources, and application performance. Total monitoring of all IBM products can be achieved and then centralized to a single dashboard, or organized based on which applications they support.
Key Features:
- Freeware Version: PRTG offers a freeware version, allowing users to monitor up to 100 sensors for free, making it an excellent option for budget-conscious organizations or smaller networks.
- Application, Network, and Infrastructure Monitoring: With comprehensive monitoring capabilities across applications, networks, and infrastructure, PRTG ensures holistic visibility into IBM Db2 services and other aspects of the IT environment.
- iOS and Android Mobile App: PRTG provides mobile monitoring capabilities with dedicated iOS and Android apps, enabling users to monitor their environment remotely and on the go.
Why do we recommend it?
Paessler PRTG offers a comprehensive monitoring solution with customizable and premade sensors, catering to diverse network, server resource, and application performance monitoring needs. Our recommendation stems from extensive testing, where PRTG consistently demonstrated its ability to provide total monitoring of IBM products, offering centralized insights into IBM Db2 services. With its freeware version and flexible deployment options, PRTG is an ideal choice for enterprises seeking scalable and customizable monitoring solutions.
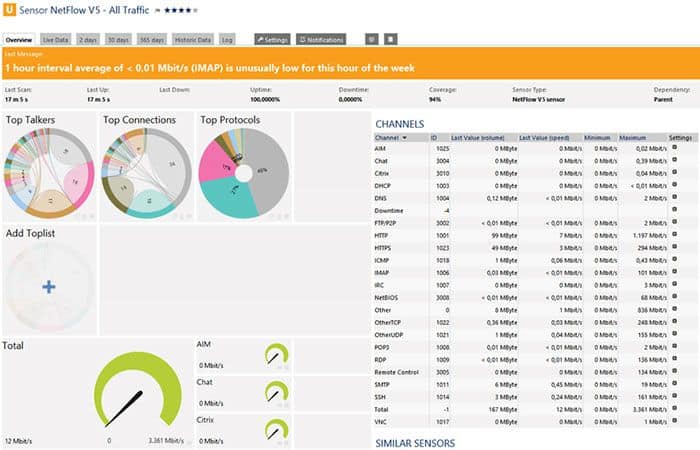
Metrics are pulled in from wherever the agent is installed, and are then visualized through a series of minimalist-style gauges graphs that offer a simple and uncluttered view into the health of your IBM Db2 services.
PRTG is a great option if you’re operating at an enterprise level and are also looking for monitoring options that can be deployed elsewhere on your network or across your servers. Since PRTG is so flexible, there’s a monitoring option for just about anything, and it all reports back to a single system which lets you organize those insights any way you want.
Flexible alerting allows for notifications to be sent out to multiple channels including email, SMS, push notifications, or API integrations into other custom solutions. One of the vastly overlooked aspects of PRTG is its mobile app offering. While many platforms have clunky monitoring apps, PRTG has put time and effort into its offering to make it a viable way to monitor your environment for both iOS and Android.
Pricing is relative to how many sensors you have deployed. Each sensor measures a particular metric. For example one sensor would be used to monitor database size in Db2, while another sensor would monitor the memory consumption of the host.
Who is it recommended for?
Paessler PRTG is recommended for IT professionals and organizations operating at the enterprise level, requiring robust monitoring options for their network, servers, and applications. Whether monitoring IBM Db2 services or other aspects of the IT infrastructure, PRTG caters to diverse needs, offering flexibility and scalability in monitoring solutions. Additionally, organizations seeking intuitive dashboards and mobile monitoring capabilities will find PRTG invaluable for optimizing performance and ensuring system reliability.
Pros:
- Customized Sensors for Detailed Monitoring: Leverages customized sensors to provide a detailed look into Apache server environments, including infrastructure components, enhancing visibility and analysis capabilities.
- Customizable Dashboard with Intuitive Widgets: Offers a customizable dashboard with intuitive widgets, enabling users to tailor the monitoring experience to their specific requirements with ease.
- Supports Free Version for Up to 100 Sensors: The free version allows monitoring of up to 100 sensors, making it an ideal choice for organizations with limited budgets or smaller networks.
- Flexible Pricing Based on Sensor Utilization: Pricing is based on sensor utilization, offering flexibility and scalability for organizations of all sizes and budgets.
Cons:
- Feature-Rich Platform Requiring Time to Learn: Offers extensive features and options, its feature-rich nature may require time for users to fully explore and utilize all functionalities effectively.
The first perpetual tier package offers 500 sensors across a single server environment for $1750. Subscription licensing is always available that only charges based on the sensors you consume.
You can test out PRTG free through a 30-day free trial. Once your trial is over your account will be reverted to the freeware version which can support only 100 sensors.
4. Datadog
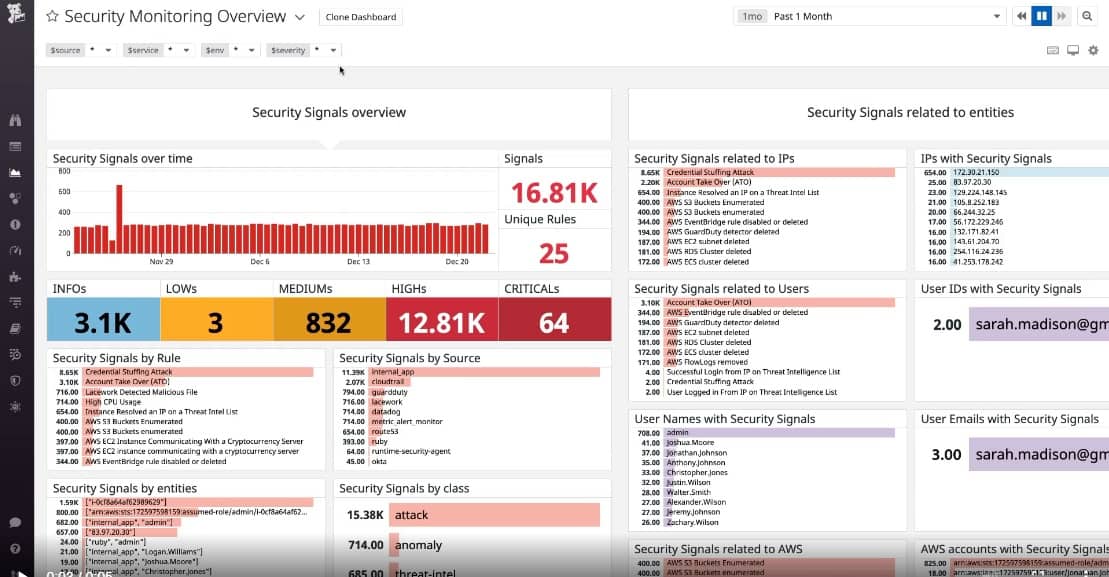
Datadog is a cloud-based monitoring platform that offers monitoring across all aspects of an organization's IT infrastructure. Datadog makes integrations incredibly easy by having prebuilt modules for specific environments, including IBM Db2.
Key Features:
- Holistic Monitoring: Offers holistic monitoring solutions, providing insights into various aspects of an organization's IT infrastructure, including IBM Db2.
- Plug and Play Dashboards and Monitors: With pre-built modules and customizable templates, Datadog simplifies monitoring setup, allowing users to quickly deploy dashboards and monitors tailored to their specific requirements.
- Simple Pricing Structure: Simple pricing structure facilitates cost-effective monitoring solutions, ensuring transparency and scalability for organizations of all sizes.
Why do we recommend it?
Datadog stands out as a cloud-based monitoring platform offering comprehensive monitoring across all aspects of an organization's IT infrastructure. Our recommendation is based on extensive testing, where Datadog consistently demonstrated its ability to provide holistic monitoring solutions, including efficient integration with IBM Db2. With its plug-and-play dashboards, simple pricing structure, and customizable templates, Datadog simplifies monitoring tasks while offering valuable insights into IBM Db2 performance.
The integration features a built-in dashboard that’s already set up to monitor and reflect some of the most important key metrics in Db2 including query rates, database size, and server resource consumption. While Datadog offers a ton of monitoring and reporting templates preconfigured, you can still customize them to your liking, or build them from scratch to make your own internal template.
The visualizations Datadog provides make it simple to catch issues like inefficient queries, or bottlenecks that occur during high traffic times. You can visibly see anomalous behavior stand out from recent historical metrics recorded, as well as take a snapshot of your IBM Db2 performance and compare that to your performance benchmarks from the past.
Since Datadog is so flexible, you can simply deploy the same agent to other areas of your network and use integration to monitor that aspect of your server or network. Dashboards can easily be set up to monitor specific databases, networks, or business processes, allowing you to cycle through them at regular intervals for quick checks.
Who is it recommended for?
Datadog is recommended for IT professionals and organizations seeking a versatile monitoring platform for their IT infrastructure. Whether monitoring IBM Db2 or other environments, Datadog caters to diverse needs, offering ease of integration, customizable dashboards, and intuitive interfaces. Additionally, organizations looking for cloud-based monitoring solutions with flexible deployment options will find Datadog invaluable for optimizing performance and ensuring system reliability.
Pros:
- Quick Insights into Apache Servers: Provides quick insights into Apache servers through pre-built templates and monitors, facilitating efficient monitoring setup and deployment.
- Great Interface with High Customization: Offers a user-friendly interface with high customization capabilities, enabling users to tailor monitoring solutions to their specific needs with ease.
- Cloud-Based SaaS Product with No Server Deployments: As a cloud-based SaaS product, Datadog eliminates the need for server deployments or onboarding fees, offering hassle-free monitoring solutions.
- Holistic Monitoring with Auto-Discovery: Supports holistic monitoring with features like auto-discovery, allowing users to build network topology maps dynamically for enhanced visibility.
- Supports Integration for Monitoring Other Areas: With its flexibility, Datadog enables users to deploy the same agent to monitor various aspects of their network, enhancing monitoring capabilities across the organization.
Cons:
- Short Trial Duration: Some users may prefer a longer trial period to fully evaluate Datadog's capabilities and determine its suitability for long-term use.
The entire platform strives to do as much of the heavy lifting as it can from a monitoring perspective. Pricing for Datadog is broken down into tiers and has separate plans for infrastructure monitoring as well as APM and profiling. Application performance monitoring starts at $31.00 per host per month and features historical analysis, trace correlation, and log retention. Add-ons are modular, meaning you don’t have to pay for a higher package just to get additional log space or large data retention windows.
You can test Datadog completely with a fully functional 14-day free trial.
5. Idera
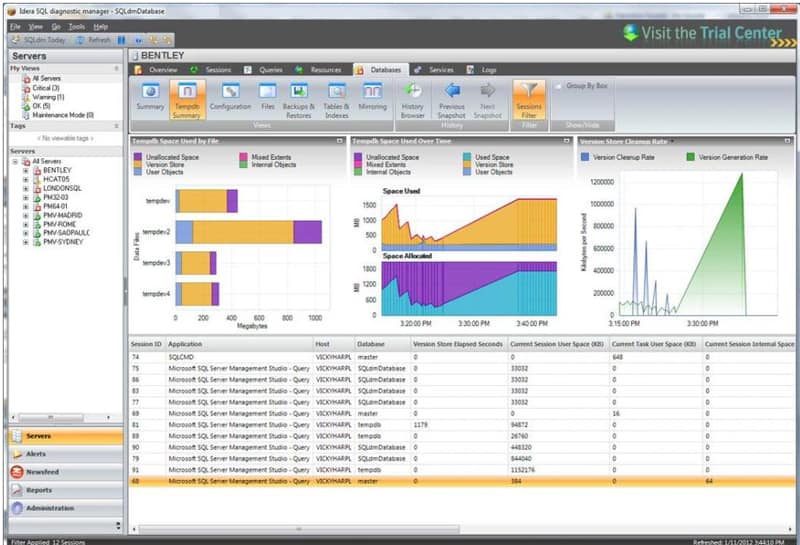
The Idera Application and Relational Database Performance Monitoring platform focuses on creating products to assist in monitoring, maintaining and managing different forms of databases. They have two separate solutions, one for monitoring Db2 instances, and another for optimizing code across DBMS platforms.
Key Features:
- Database Optimization Tools: Provides a suite of database optimization tools, empowering DBAs to create more efficient data models and streamline database changes for improved performance.
- Data Modeling Tools: With data modeling capabilities, Idera facilitates the creation of efficient database structures, enabling DBAs to design and implement optimized databases.
- DBA Focused: Idera's platform is specifically designed with DBAs in mind, offering features and functionalities tailored to address the unique challenges of database administration and performance monitoring.
Why do we recommend it?
Idera's Application and Relational Database Performance Monitoring platform stands out as a comprehensive solution tailored to assist in monitoring, maintaining, and managing various types of databases. Our recommendation is rooted in extensive testing, where Idera consistently proved its effectiveness in optimizing database performance and streamlining management tasks. With its focus on database optimization and data modeling, Idera offers invaluable tools for DBAs seeking to enhance efficiency and maintain peak performance across DBMS platforms.
On top of just providing basic reporting and metrics, Idera can help DBAs create more efficient data models, streamline database changes, and identify queries that could be improved.
Who is it recommended for?
Idera is recommended for database administrators (DBAs) and organizations requiring robust database monitoring and optimization solutions. Whether managing Db2 instances or optimizing code across DBMS platforms, Idera caters to DBAs' diverse needs, offering intuitive tools for streamlining database management tasks and improving query performance. Additionally, organizations seeking user-friendly interfaces and collaborative features will find Idera invaluable for enhancing team productivity and achieving optimal database performance.
Pros:
- Simple yet Powerful Interface: Boasts a user-friendly interface, making it ideal for new users while offering powerful functionalities for experienced DBAs.
- Auto-Formatting and Syntax Color: The platform's auto formatting and syntax color features aid DBAs in staying organized, particularly when managing databases at scale.
- Presets and Recommendations for Performance Improvement: Offers numerous presets and recommendations to improve database performance out of the box, simplifying optimization efforts for DBAs.
- Supports Collaboration with Real-Time Feedback: Idera facilitates collaboration among teams with real-time feedback and team features, enhancing communication and productivity among DBA teams.
Cons:
- Short Trial Duration: Some users may find the trial period to be insufficient for fully evaluating the platform's capabilities and determining its suitability for long-term use.
You can test out any one of the Db2 tools through a 30-day free trial.
6. SolarWinds Server & Application Monitor
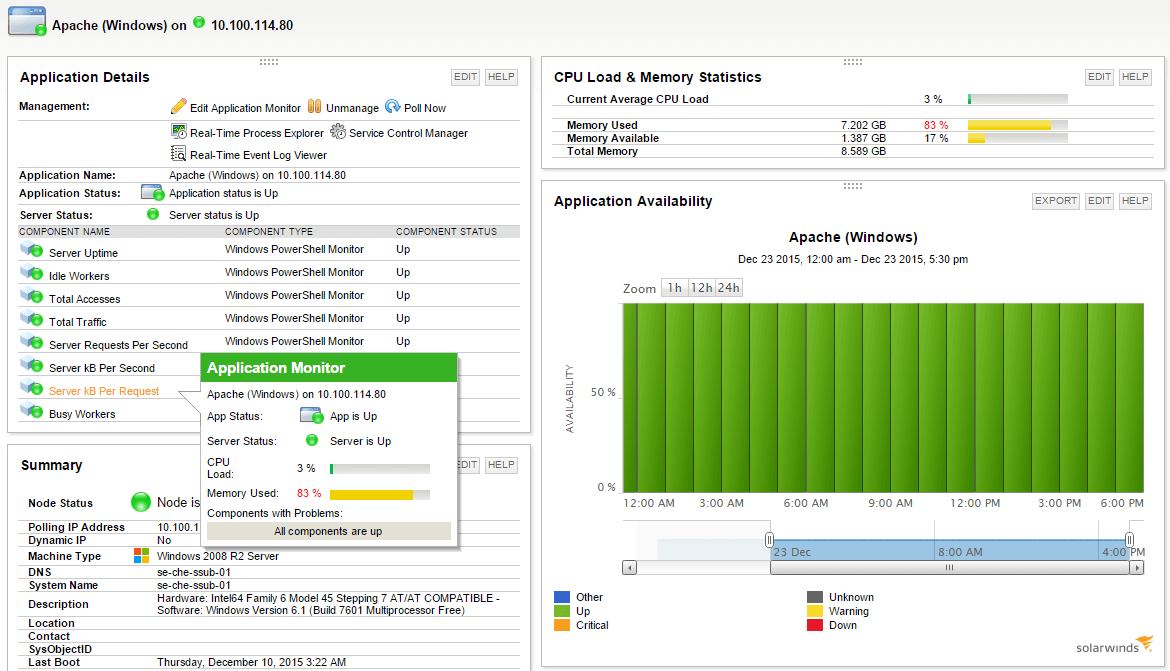
SolarWinds Server & Application Monitor (SAM) is a complete monitoring platform that gives organizations the ability to monitor IDM database servers, as well as the health and performance of the host server and supporting network infrastructure.
Key Features:
- Network, Server, and Application Monitoring: SAM provides comprehensive monitoring across networks, servers, and applications, ensuring holistic visibility into system performance.
- Dependency Mapping: The platform offers dependency mapping features, allowing users to visualize and understand how different network components impact IBM Db2 servers' availability and performance.
- 1200 Alert and Monitoring Templates: With a vast library of templates, SAM simplifies the monitoring setup process, making it easy to deploy and customize monitoring for various servers and databases, including IBM Db2.
- Agentless Architecture: SAM's agentless architecture enables live monitoring without the need for complex installations, ensuring real-time insights into system performance.
- Customizable Dashboards: Users can tailor SAM's dashboard using drag-and-drop widgets, creating personalized views to monitor key metrics and performance indicators effectively.
Why do we recommend it?
SolarWinds Server & Application Monitor (SAM) stands out as a comprehensive monitoring platform, providing unparalleled insights into IDM database servers' health and performance. Our recommendation stems from extensive testing, where SAM consistently proved its efficiency in monitoring host servers and supporting network infrastructure. With its user-friendly interface and robust feature set, SAM simplifies the monitoring process while offering in-depth analytics crucial for maintaining optimal system performance.
SAM features templates for dozens of different servers and databases including IBM Db2 databases. The templates make monitoring on multiple platforms simple and easy to set up. Once deployed, the agent will begin reporting metrics like average buffer size, total database space available, the index hit ratio, and average read time along with about a dozen other performance metrics.
When monitoring the network as a whole you can use the infrastructure dependency mapping feature to understand how other areas of your network directly impact the availability and performance of your IBM Db2 servers.
Who is it recommended for?
SAM is recommended for IT professionals and organizations seeking a reliable monitoring solution for their IDM database servers. Small to large enterprises looking to streamline their monitoring processes and enhance system performance will benefit from SAM's extensive features. Additionally, IT teams managing multiple platforms and databases, including IBM Db2, will find SAM invaluable for its seamless integration and comprehensive monitoring capabilities.
Pros:
- ‘Done for You' Dashboards and Templates for Apache Webserver: SAM offers pre-built dashboards and templates specifically designed for Apache webserver monitoring, saving time and resources for users.
- Live Monitoring Through Agentless Architecture: SAM provides real-time monitoring capabilities without requiring agents, simplifying the monitoring setup and ensuring immediate insights into system performance.
- Auto-Discovery and Network Topology Mapping: SAM's auto-discovery feature generates network topology maps and inventory lists in real-time, enhancing visibility into network assets and configurations.
Cons:
- Feature-Rich Interface May Require Time to Explore: While SAM offers a wealth of features, its comprehensive nature may necessitate time for users to fully explore and utilize all functionalities effectively.
SolarWinds Server & Application Monitor starts at $1622 and has options for both perpetual and subscription-based licensing. You can test out SAM through a 30-day free trial.
7. AppDynamics
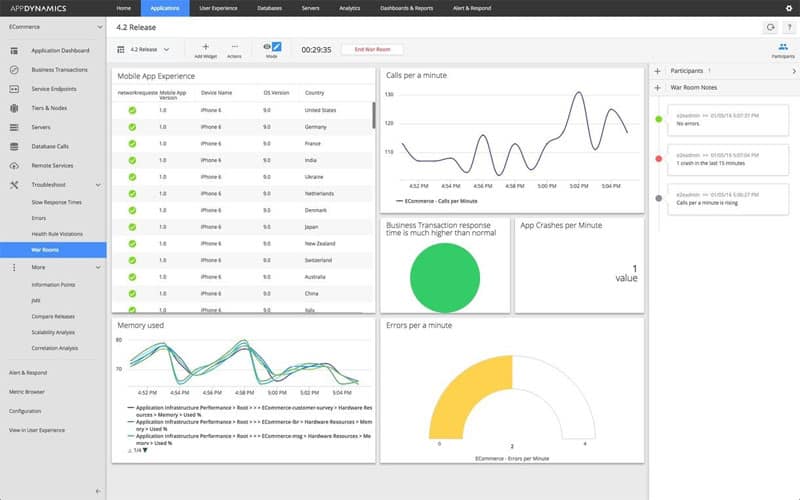
AppDynamics offers end-to-end monitoring of multiple IBM platforms including Db2 products. AppDynamics combines detailed monitoring, vibrant graphics, and simple alerting to cover multiple mainframe architectures.
Key Features:
- Enterprise-Level Scalability: AppDynamics provides enterprise-level scalability, ensuring compatibility and reliability for organizations of all sizes.
- Deep Monitoring into the IBM Ecosystem: With deep monitoring capabilities across multiple IBM platforms, including Db2, AppDynamics offers comprehensive insights into the IBM ecosystem.
- Interactive Reporting: AppDynamics offers interactive reporting features, allowing users to visualize and compare key performance metrics across recent and historical timelines with ease.
Why do we recommend it?
AppDynamics offers comprehensive end-to-end monitoring for multiple IBM platforms, including Db2 products, making it a top choice for organizations seeking robust monitoring solutions. Our recommendation is based on thorough testing, where AppDynamics consistently demonstrated its ability to provide detailed monitoring, vibrant graphics, and simple alerting across multiple mainframe architectures. With its enterprise-level scalability, deep monitoring capabilities, and interactive reporting features, AppDynamics is well-suited for organizations of all sizes seeking comprehensive performance monitoring solutions.
The agent automatically can discover different IBM Db2 products, servers, and mainframe and catalog them in the monitoring dashboard. A topological map is also created that acts as a live and navigable dashboard where you can visualize dependencies between certain systems, and see bottlenecks quickly.
The platform offers performance monitoring across CICS, IMS DB, MQ, and Db2 through a single agent. AppDynamics deploys several forms of intelligent monitoring to dynamically monitor baseline performance as well as perform on the fly root cause analysis and basic diagnostics. If anyone of these systems detects an issue, automation can be put in place to either run an automated repair or alert a helpdesk team.
Comprehensive performance reports allow DBAs to easily visualize and compare key performance metrics across recent and historical timelines. These reports can be sent in dashboard form that allows them to be interactive, and see the details of past performance issues with a simple click.
Who is it recommended for?
AppDynamics is recommended for IT professionals and organizations requiring end-to-end monitoring solutions for their IBM platforms, including Db2 products. Whether managing large-scale enterprise environments or complex application systems, AppDynamics caters to diverse needs, offering detailed monitoring, dependency mapping, and root cause analysis capabilities. Additionally, organizations seeking intuitive visualizations and interactive reporting features will find AppDynamics invaluable for optimizing performance and ensuring system reliability.
Pros:
- Tailored for Large-Scale Enterprise Use: Tailored for large-scale enterprise environments, offering robust monitoring solutions for complex application systems.
- Excellent Dependency Mapping and Visualizations: Provides excellent dependency mapping and visualizations, facilitating troubleshooting of complex application systems and identifying bottlenecks quickly.
- Leverages AI and Machine Learning for Root Cause Analysis: With AI and machine learning capabilities, AppDynamics offers advanced root cause analysis and remediation steps, enhancing proactive management and issue resolution.
- Includes a Free Version: Offers a free version, allowing users to experience its monitoring capabilities before committing to a paid plan.
Cons:
- Short Trial Period: Some users may prefer a longer trial period to fully evaluate AppDynamics' features and capabilities, especially considering its suitability for larger, more complex networks.
- Features Designed for Larger Networks: While AppDynamics excels in monitoring large-scale enterprise environments, its features may not be ideal for smaller networks with simpler configurations.
Pricing of AppDynamics for both APM and infrastructure monitoring starts at $90.00 per month per CPU core. You can test out AppDynamics completely free through a 15-day trial.
8. Opsview
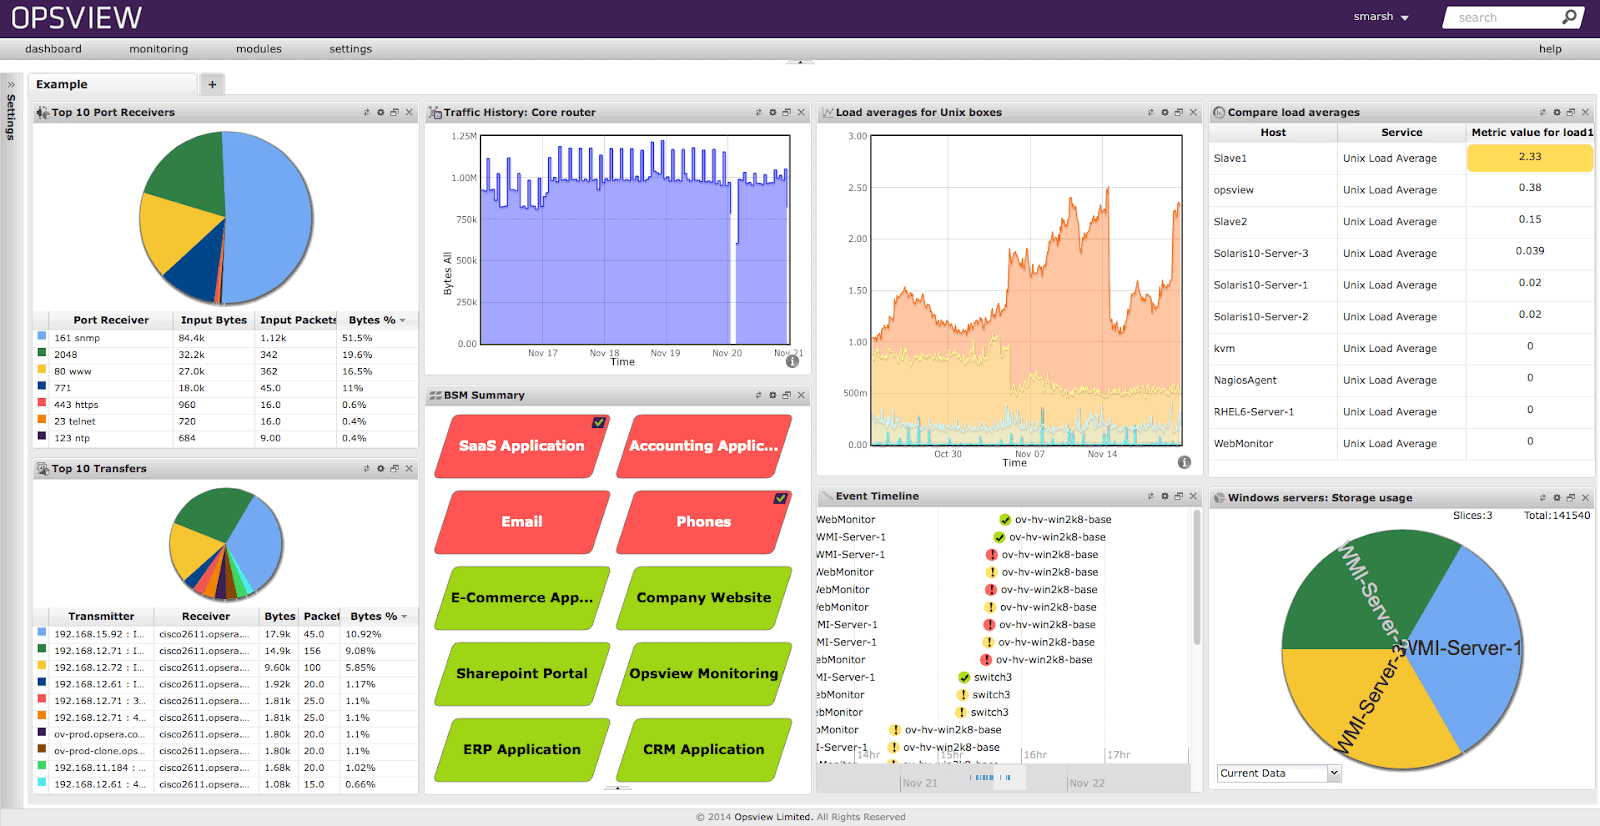
Opsview works to bridge the gap between application, network, and infrastructure monitoring by offering custom integrations into different environments through Opspacks. Each Opspack consists of a platform integration as well as a series of pre-configured service checks, dashboards, and alert templates.
Key Features:
- Simple Integrations: Opsview offers simple integrations through Opspacks, providing pre-configured service checks, dashboards, and alert templates for efficient monitoring setup.
- Small Business Pricing Option: With small business pricing options available, Opsview offers cost-effective monitoring solutions suitable for organizations of all sizes.
- On-Premises and Cloud Monitoring Options: Opsview provides flexibility in deployment with options for both on-premises and cloud monitoring, ensuring compatibility with diverse infrastructure environments.
Why do we recommend it?
Opsview stands out for bridging the gap between application, network, and infrastructure monitoring, offering custom integrations and pre-configured service checks through Opspacks. Our recommendation is based on its simplicity in integrations, small business pricing options, and versatility in deployment, whether on-premises or in the cloud. With its dedicated Opspack for Db2 and autodiscovery features, Opsview is a suitable choice for organizations seeking comprehensive Db2 monitoring solutions at a higher level.
The Opspack for Db2 allows for cross-platform Db2 monitoring on Windows, Linux, and UNIX operating systems. Opsview is a good choice for organizations that are looking to deploy monitoring of their Db2 server at a higher level.
Autodiscovery ensures that new hosts are always included in the inventory and that agents are always able to interact and monitor new databases or server environments. Since Opsview offers a suite of monitoring agents, full organization-wide monitoring can be achieved on the platform.
Who is it recommended for?
Opsview is recommended for organizations seeking efficient monitoring solutions that span across applications, networks, and infrastructure. Whether monitoring Db2 servers on Windows, Linux, or UNIX operating systems, Opsview caters to diverse needs, offering simplicity in integrations and scalability in monitoring capabilities. Additionally, organizations looking for clean, easy-to-use interfaces and options for both free and paid versions will find Opsview invaluable for optimizing performance and ensuring system reliability.
Pros:
- Supports J-Flow, NetFlow, and sFlow Monitoring: Supports various monitoring protocols, including J-Flow, NetFlow, and sFlow, enhancing visibility into network traffic and performance.
- Offers Premade Sensors: Provides premade sensors, facilitating quick setup and deployment for users, especially beneficial for getting started right away.
- Clean, Easy-to-Use Interface: Boasts a clean and easy-to-use interface, ensuring user-friendly navigation and management of monitoring tasks.
- Supports Free and Paid Versions: Offers both free and paid versions, allowing users to choose the option that best fits their budget and requirements.
Cons:
- Requires Opsview Monitor for J-Flow Stream Monitoring: Some features, such as monitoring J-Flow streams, require Opsview Monitor, which may necessitate additional configuration or setup.
Pricing for Opspack is broken down into three options, SMB, Enterprise, and Opsview Cloud. The cloud version is designed to support all sizes, while the SMB is built for organizations with under 300 hosts. Pricing for the SMB package starts at $1300 annually. Pricing for the other packages is not publicly listed.
You can test Opspacks by requesting a demo.
9. IBM Db2 Data Management Console
The IBM Db2 Data Management Console is a solution developed by none other than IBM themselves as a way for DBAs to manage and monitor the performance of their Db2 databases at scale.
Key Features:
- Focused Solely on IBM Db2 Monitoring: The Data Management Console is designed exclusively for monitoring IBM Db2 databases, ensuring specialized features and functionalities tailored to Db2 environments.
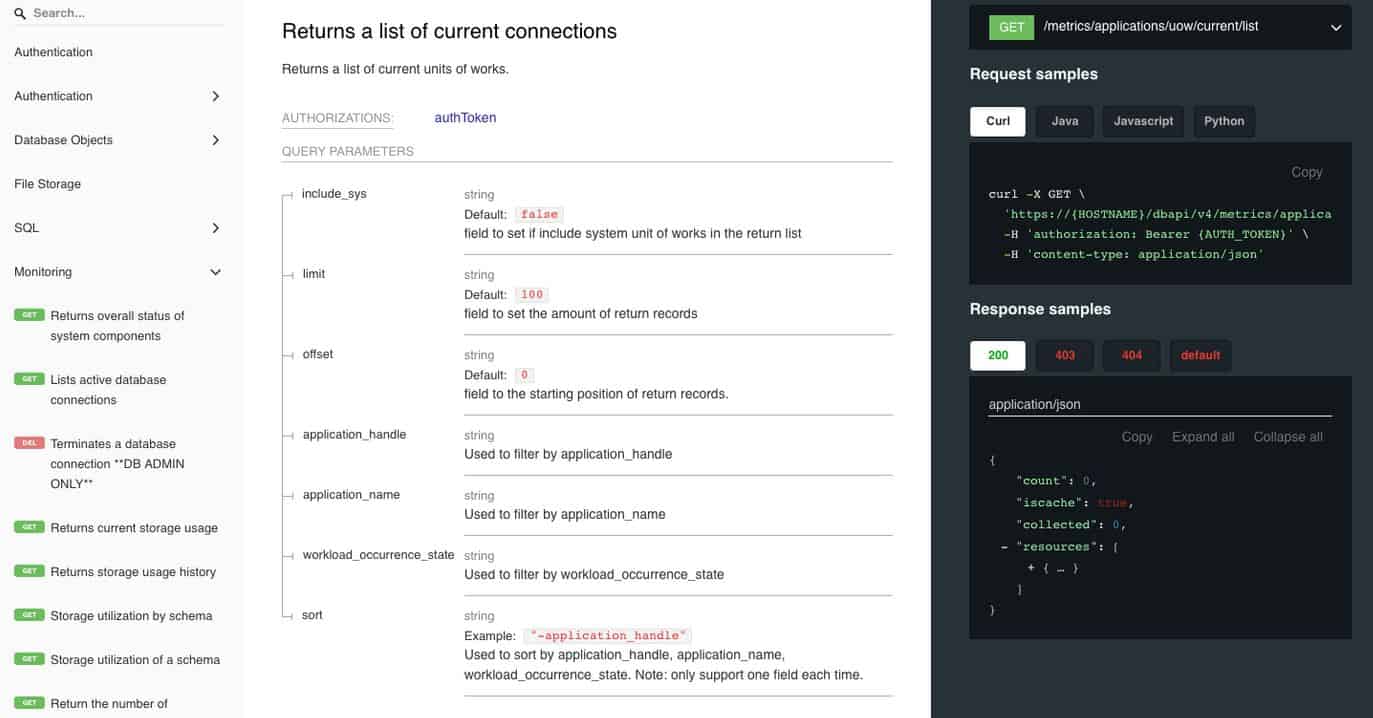
- Fully Integrated SQL Editor: With a built-in SQL editor, the Data Management Console enables DBAs to perform troubleshooting and testing tasks efficiently without the need for external tools.
- Database Object Management: The console facilitates management and administration of database objects, allowing users to edit objects in real-time and track performance metrics across databases and clusters.
Why do we recommend it?
The IBM Db2 Data Management Console, developed by IBM, offers DBAs a comprehensive solution for managing and monitoring Db2 databases at scale. Our recommendation is rooted in its focus solely on IBM Db2 monitoring, integrated SQL editor, and database object management features. With its browser-based interface and real-time historical monitoring capabilities, the Data Management Console provides efficient performance benchmarking and database administration, making it an essential tool for DBAs managing Db2 environments.
The browser-based console allows users to manage and administer their databases while also tracking performance metrics across individual databases and clusters alike. It features real time historical monitoring for quick performance benchmarking, as well as live editing of database objects on the fly.
A backend SQL editor can be used alongside the management console to help administrators save time from going back and forth while performing troubleshooting or testing tasks. For larger dev teams it offers a clean UI with team collaboration features that feel intuitive and are easy to use.
Features like LDAP integrations, and a larger API library make the management console ready for enterprises who use IBM products at scale. While the console has some great features, it fails to monitor other aspects of the enterprise on the network and server level. This can leave a blind spot in troubleshooting issues that exist outside of the Db2 ecosystem.
For organizations that also have multiple clouds, servers, and network environments this will be another dashboard to keep track of. Utilizing a holistic monitoring tool like Datadog or Site24x7, or SAM can consolidate your monitoring efforts and simplify them into a single dashboard and remediation center.
Who is it recommended for?
The IBM Db2 Data Management Console is recommended for database administrators (DBAs) and organizations relying on Db2 databases for their data management needs. Whether managing individual databases or clusters, the Data Management Console caters to diverse needs, offering real-time monitoring, SQL editing capabilities, and team collaboration features. Additionally, organizations seeking an intuitive and well-supported solution for Db2 management and monitoring will find the Data Management Console invaluable for streamlining database administration tasks.
Pros:
- Completely Free – Included with Db2 Deployments: Provided free of charge with Db2 deployments, making it accessible to organizations of all sizes without additional costs.
- Easy to Use: The console boasts a user-friendly interface, making it easy for DBAs to navigate and utilize its features for efficient database management and monitoring.
- Well Documented and Thoroughly Supported: With comprehensive documentation and support from IBM, the Data Management Console ensures reliable assistance and guidance for users, enhancing usability and troubleshooting capabilities.
Cons:
- Fails to Monitor Other Applications and Parts of the Network: While the Data Management Console excels in monitoring Db2 databases, it lacks capabilities to monitor other applications and components of the network, potentially creating blind spots in troubleshooting efforts outside the Db2 ecosystem.
IBM Db2 Data Management Console is free and included with all editions of DB3 and is a part of the Db2 family.
Which IBM Db2 monitoring tool is right for you?
For DBAs looking for more out of their existing monitoring tools, SolarWinds Server & Application Monitor offers an excellent on-premises solution for monitoring Db2 databases as well as supporting mainframes and network.
Those who wish to utilize a cloud monitoring solution will find both Datadog and Site24x7 to be competitive options that allow DBAs to quickly deploy monitoring agents and receive near instant insights into multiple layers of their IBM environment.
Are you currently monitoring your Db2 databases? What have been your biggest challenges with monitoring? Let us know in the comments below.
IBM Db2 Monitoring Tools FAQs
What are some common metrics to monitor for IBM Db2?
- CPU utilization
- Memory usage
- Disk space usage
- Connection usage
- SQL statement performance
What are some popular IBM Db2 monitoring tools?
- IBM Data Server Manager
- SolarWinds Database Performance Analyzer
- AppDynamics
- Quest Foglight for Databases
- Spotlight on IBM Db2
What are some benefits of using IBM Db2 monitoring tools?
- Improved performance and efficiency of the database
- Proactive identification and resolution of issues
- Increased security and compliance
- Better insights into the behavior and performance of the database
How can I choose the right IBM Db2 monitoring tool for my organization?
When choosing an IBM Db2 monitoring tool, you should consider factors such as the features and functionality that are most important to your business, the ease of use and deployment, the level of customer support, and the pricing and licensing model. You may also want to evaluate the vendor's reputation and customer reviews.
How can I get started with IBM Db2 monitoring?
To get started with IBM Db2 monitoring, you should first identify the key metrics and performance indicators that are most important to your business, and determine the tools and processes needed to monitor and analyze those metrics. You can then choose an IBM Db2 monitoring tool that best fits your needs and begin implementing it in your organization. There are many resources available online to help you learn more about IBM Db2 monitoring and how to use it effectively.