We may earn a commission if you make a purchase through the links on our website.
The Best Tools to Monitor & Debug JavaScript
UPDATED: March 19, 2025
From error monitoring tools to debugging IDEs, tools to monitor & debug JavaScript will help you identify and mitigate bugs during JavaScript development. Bugs can crop up both during and after deployment, and ensuring that your JavaScript projects are bug-free is an important responsibility. There are various tools available on the market to help you reduce bugs that might arise during development, and there are similarly a large number of tools available to help identify and fix bugs post-deployment.
Here is our list of the best tools to monitor & debug JavaScript:
- Site24x7 – EDITOR'S CHOICE Top choice for JavaScript monitoring with real-time insights and comprehensive user experience analysis. Start a 30-day free trial.
- Airbrake An error and performance monitoring solution that can integrate with various products for seamless bug notifications and issue mitigation.
- Sentry A complete bug tracking and performance monitoring tool with excellent options for obtaining detailed input on bug reports and actionable insights that are tightly correlated to your development.
- Glitchtip An open-source bug-reporting option offers all of the basic features of paid programs while remaining wholly accessible and adaptable.
- Raygun This solution contains a suite of bug diagnosis and fixing mitigation tools, developed primarily for crash reporting and bug monitoring.
- Rollbar An approach for bug reporting and error aggregation that offers various notification control and tracking options to help you optimize your debugging process.
- Komodo IDE An open-source IDE with great debugging features and VCS integration that supports numerous languages (including JavaScript).
- Visual Studio One of the best IDEs on the market regarding its intelligent debugging tools, the solution comes with a suite of tailor-made debugging utilities.
- JS Bin A straightforward open-source JavaScript-specific debugging tool that includes collaborative debugging features.
- Selenium A free, open-source testing framework with full CI/CD pipeline integration that offers in-depth test scripting capabilities.
This article runs through different debugging and error-monitoring tools that will assist your debugging process. They can be divided into two main categories: those that help during development, and those that help after the product has been shipped.
Development Debugging (IDEs)
While developing your JavaScript projects, the debugging process is all about preventing mistakes and spotting them before the product is shipped. A rigorous testing phase is typically where most bugs are found, but that ties into post-deployment discussed below.
During development, the biggest tool to help you with debugging is your IDE. This article discusses several IDEs that can spot errors and bugs as they might crop up. Several solutions include intelligent debugging utilities that go above and beyond simple error events.
Post-Deployment Debugging (Error Reporters)
Generally speaking, the majority of your bugs will be discovered by your testers, and even after releasing your product, your end-users will also undoubtedly run into bugs as they crop up. Of course, browser testing tools can find these problems, but error-reporting solutions will massively expand on your Javascript bug monitoring.
These products aggregate bug reports that are submitted either by your testers or end-users. Some products expand on this by integrating with your development environment to allow you to immediate action bug reports. Some even integrate with CI/CD workflow solutions to smooth the bug-fixing process.
The Best Tools to Monitor and Debug JavaScript
1. Site24x7 – FREE TRIAL
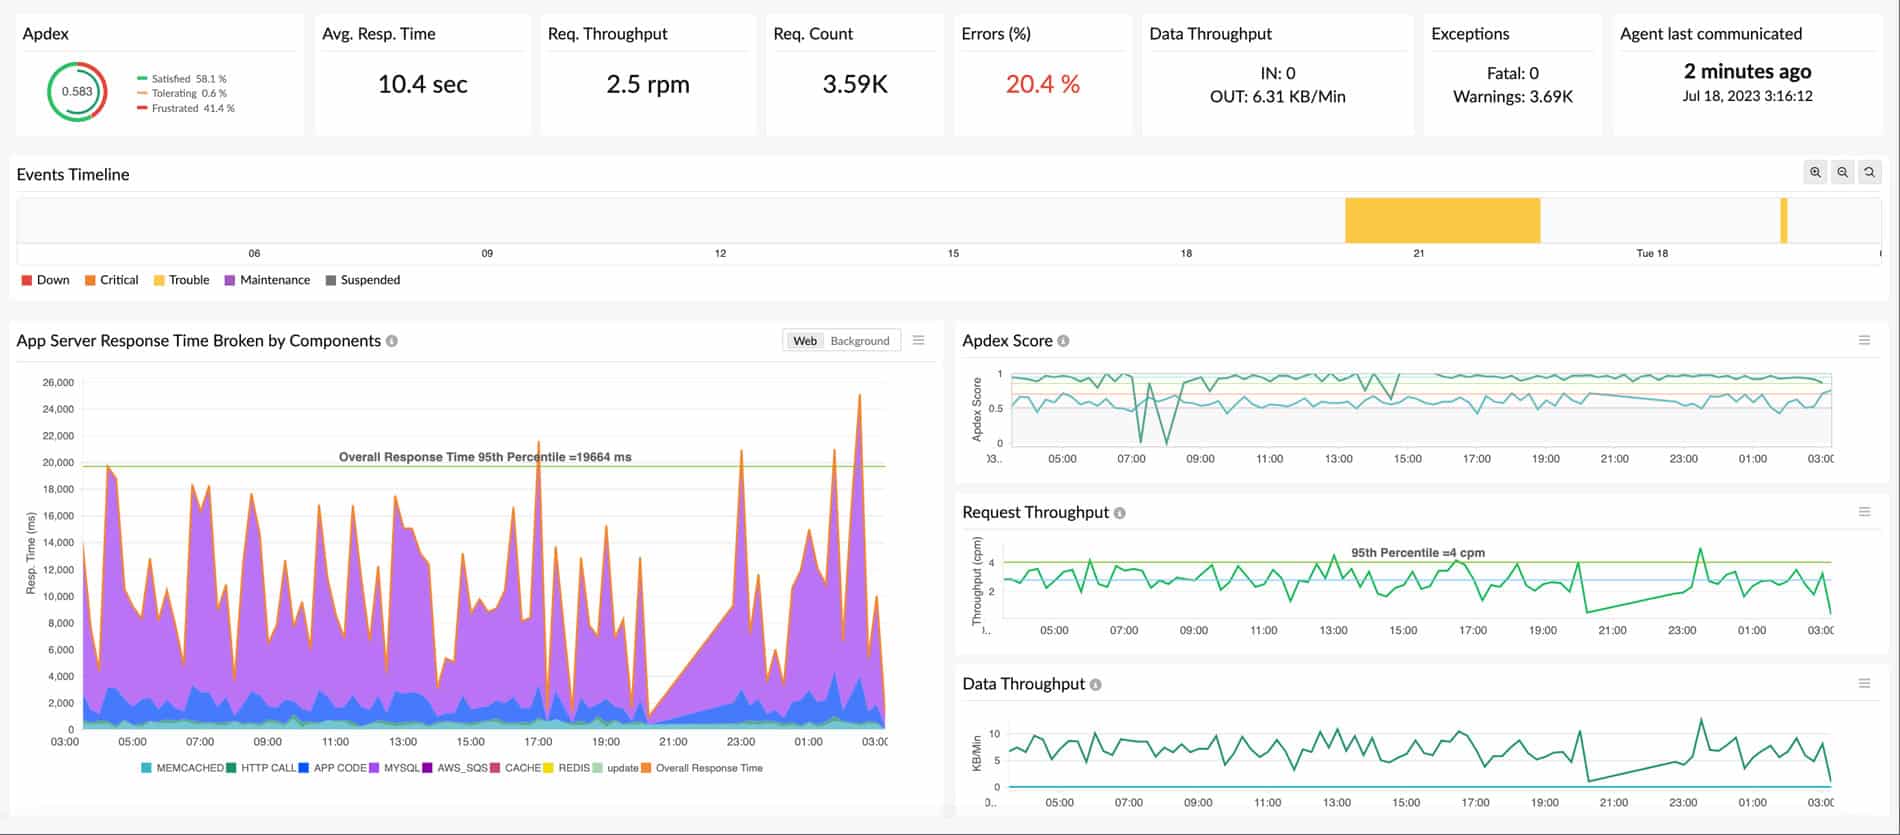
In the realm of JavaScript monitoring, Site24x7 stands out as an exceptional tool, especially for those looking to ensure seamless web application performance. This cloud-based monitoring solution excels in providing real-time analytics and performance insights for JavaScript-based applications. Given the intricacy and dynamic nature of modern JavaScript frameworks and libraries, Site24x7's ability to offer detailed monitoring and diagnostic capabilities is invaluable.
Key Features:
- Real-Time JavaScript Error Tracking: Monitors JavaScript errors in real time, enabling prompt identification and resolution of issues.
- Performance Analytics for JavaScript-Based Applications: Provides detailed performance analytics to optimize JavaScript application performance.
- User Session Tracking and Heatmaps: Tracks user sessions and provides heatmaps for deeper insights into user interactions.
- Detailed Reporting and Alerting Mechanisms: Generates comprehensive reports and alerts to keep developers informed about application performance.
- Browser Performance Monitoring: Monitors browser performance to identify and address performance bottlenecks.
Why do we recommend it?
Site24x7 earns our recommendation for its exceptional JavaScript monitoring capabilities, specifically designed to ensure seamless web application performance. With its cloud-based monitoring solution, Site24x7 offers real-time analytics and performance insights crucial for optimizing JavaScript-based applications. Its ability to provide detailed monitoring and diagnostic features for modern JavaScript frameworks and libraries sets it apart as a vital tool for developers striving for superior user experience.
Who is it recommended for?
Site24x7 is particularly well-suited for web developers and teams managing complex JavaScript applications. Its comprehensive approach to JavaScript monitoring makes it ideal for those seeking a holistic view of their application's performance, from server to browser. Whether you're an experienced developer or a team managing multiple web applications, Site24x7 offers the insights and tools necessary to ensure optimal performance and user satisfaction.
Pros:
- Extensive JavaScript Error Tracking: Offers robust capabilities for tracking JavaScript errors, ensuring prompt issue resolution.
- Detailed Analytics and User Session Insights: Provides comprehensive analytics and insights into user sessions, facilitating informed decision-making.
- Comprehensive Reporting and Alerting System: Generates detailed reports and alerts to keep developers informed about application performance and issues.
Cons:
- Overwhelming for Beginners: Due to its extensive feature set, Site24x7 may be overwhelming for beginners initially, requiring time to familiarize themselves with its capabilities.
EDITOR'S CHOICE
Site24x7's JavaScript monitoring capabilities earn it our top spot as the preferred tool for web application performance management. Its ability to provide real-time insights into JavaScript errors and user experience is unparalleled, making it an indispensable asset for web developers. What I particularly appreciate about Site24x7 is its comprehensive approach – from tracking user interactions to detailed performance analytics, it covers all aspects of JavaScript monitoring. Its intuitive interface simplifies the complex task of identifying and resolving web application issues, enhancing both developer efficiency and user satisfaction. This tool is a game-changer, especially in an era where web application performance is crucial for business success. Site24x7 not only helps in proactive issue resolution but also plays a vital role in optimizing the overall user experience, making it our top recommendation for JavaScript monitoring.
Download: Get a 30-day free trial
Official Site: https://www.site24x7.com
OS: Cloud-based
2. Airbrake
Airbrake is an error monitoring platform that provides performance monitoring and deployment tracking features. The platform is built specifically with developers in mind and has support for JavaScript, among other languages. However, the biggest draw for Airbrake is the fast, lightweight installation and rapid integration.
Key Features:
- Error and Performance Monitoring: Provides real-time monitoring of errors and performance issues, enabling swift identification and resolution.
- Deployment Tracking: Tracks deployments to pinpoint the source of errors and monitor the impact of changes on application performance.
- Mitigation Tools: Offers tools such as code snapshots for easier bug mitigation and resolution.
- CI/CD Integration: Integrates seamlessly with CI/CD pipelines for automated error monitoring and deployment tracking.
- Multi-Language Support: Supports multiple languages, including JavaScript, ensuring compatibility with a wide range of development environments.
Why do we recommend it?
Airbrake earns our recommendation as a top-tier error monitoring platform tailored specifically for developers. Its robust features, including error and performance monitoring, deployment tracking, and mitigation tools, make it indispensable for identifying and resolving issues swiftly. Moreover, its support for JavaScript and other languages, coupled with fast and lightweight installation, ensures seamless integration into development workflows, enhancing productivity and efficiency.
The error reporting tools provide immediate notifications and integrate Slack, Trello, Github, etc., for better bug notifications and workflow management. In addition, the code snapshots and breadcrumbs features make bug mitigation easier, and the user monitoring provides in-depth information about who is discovering your bugs.
Who is it recommended for?
Airbrake is highly recommended for developers and development teams seeking a comprehensive error monitoring solution. It is particularly suitable for medium to enterprise-level dev teams looking to streamline bug detection and resolution processes. With its customizable interface, extensive integrations, and support for multiple languages, Airbrake caters to the diverse needs of development teams striving for excellence in software quality and performance.
Pros:
- Highly Customizable Interface: Allows developers to tailor error monitoring and workflow management to their specific needs.
- Various Integrations: Integrates with team platforms like Slack and Jira for efficient bug notifications and workflow management.
- Supports JavaScript and Other Languages: Provides support for JavaScript as well as other programming languages, ensuring broad compatibility.
- Lightweight and Fast Installation: Boasts fast and lightweight installation, minimizing setup time and resource usage.
- Flexible Pricing: Offers flexible pricing options to accommodate the needs of different-sized development teams.
Cons:
- Better-Suited for Medium to Enterprise Dev Teams: While suitable for developers of all levels, Airbrake may be better suited for medium to enterprise-level development teams due to its extensive feature set and pricing structure.
There is a 30-day free trial available for all of the product’s features. In addition, the product itself is divided into pricing Tiers that determine capacity. The Tier 1 package supports 25k errors and costs $19 per month. At the same time, the Tier 4 package supports up to 1 million errors and costs $299 per month.
These tiered packages are split between both performance monitoring and error monitoring. This means for both toolsets combined; you’re effectively paying double the price for each tier. Depending on your capacity needs, this might mean Airbrake is out of your budget, so it's worth considering your exact capacity demands.
3. Sentry
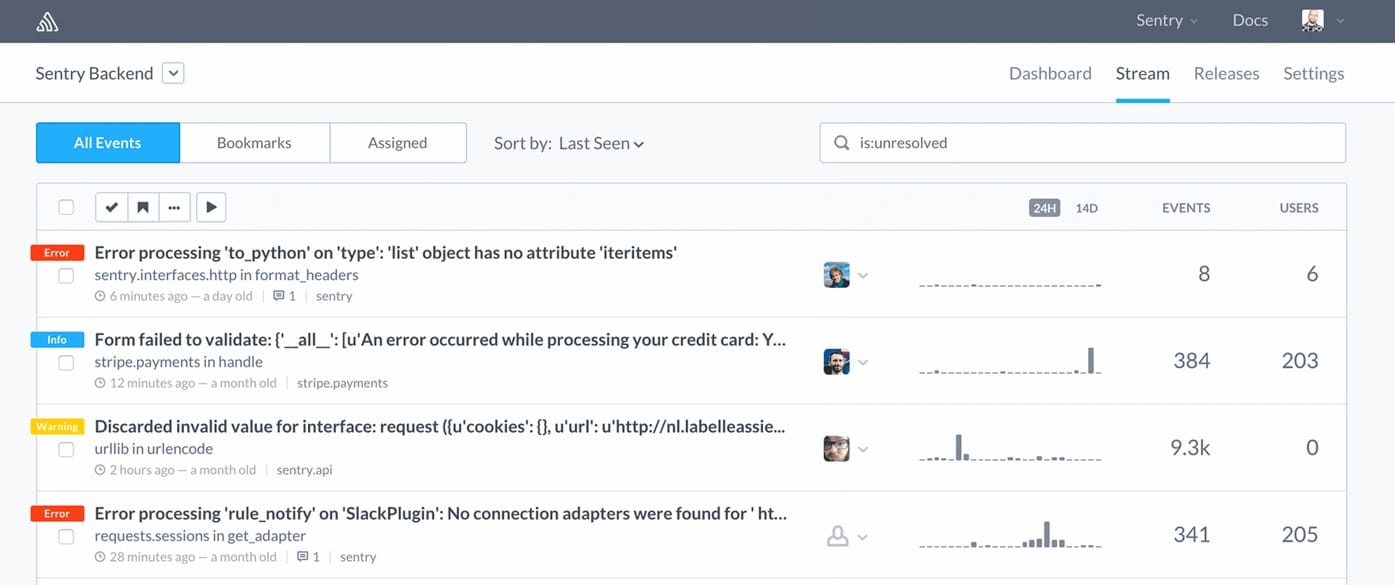
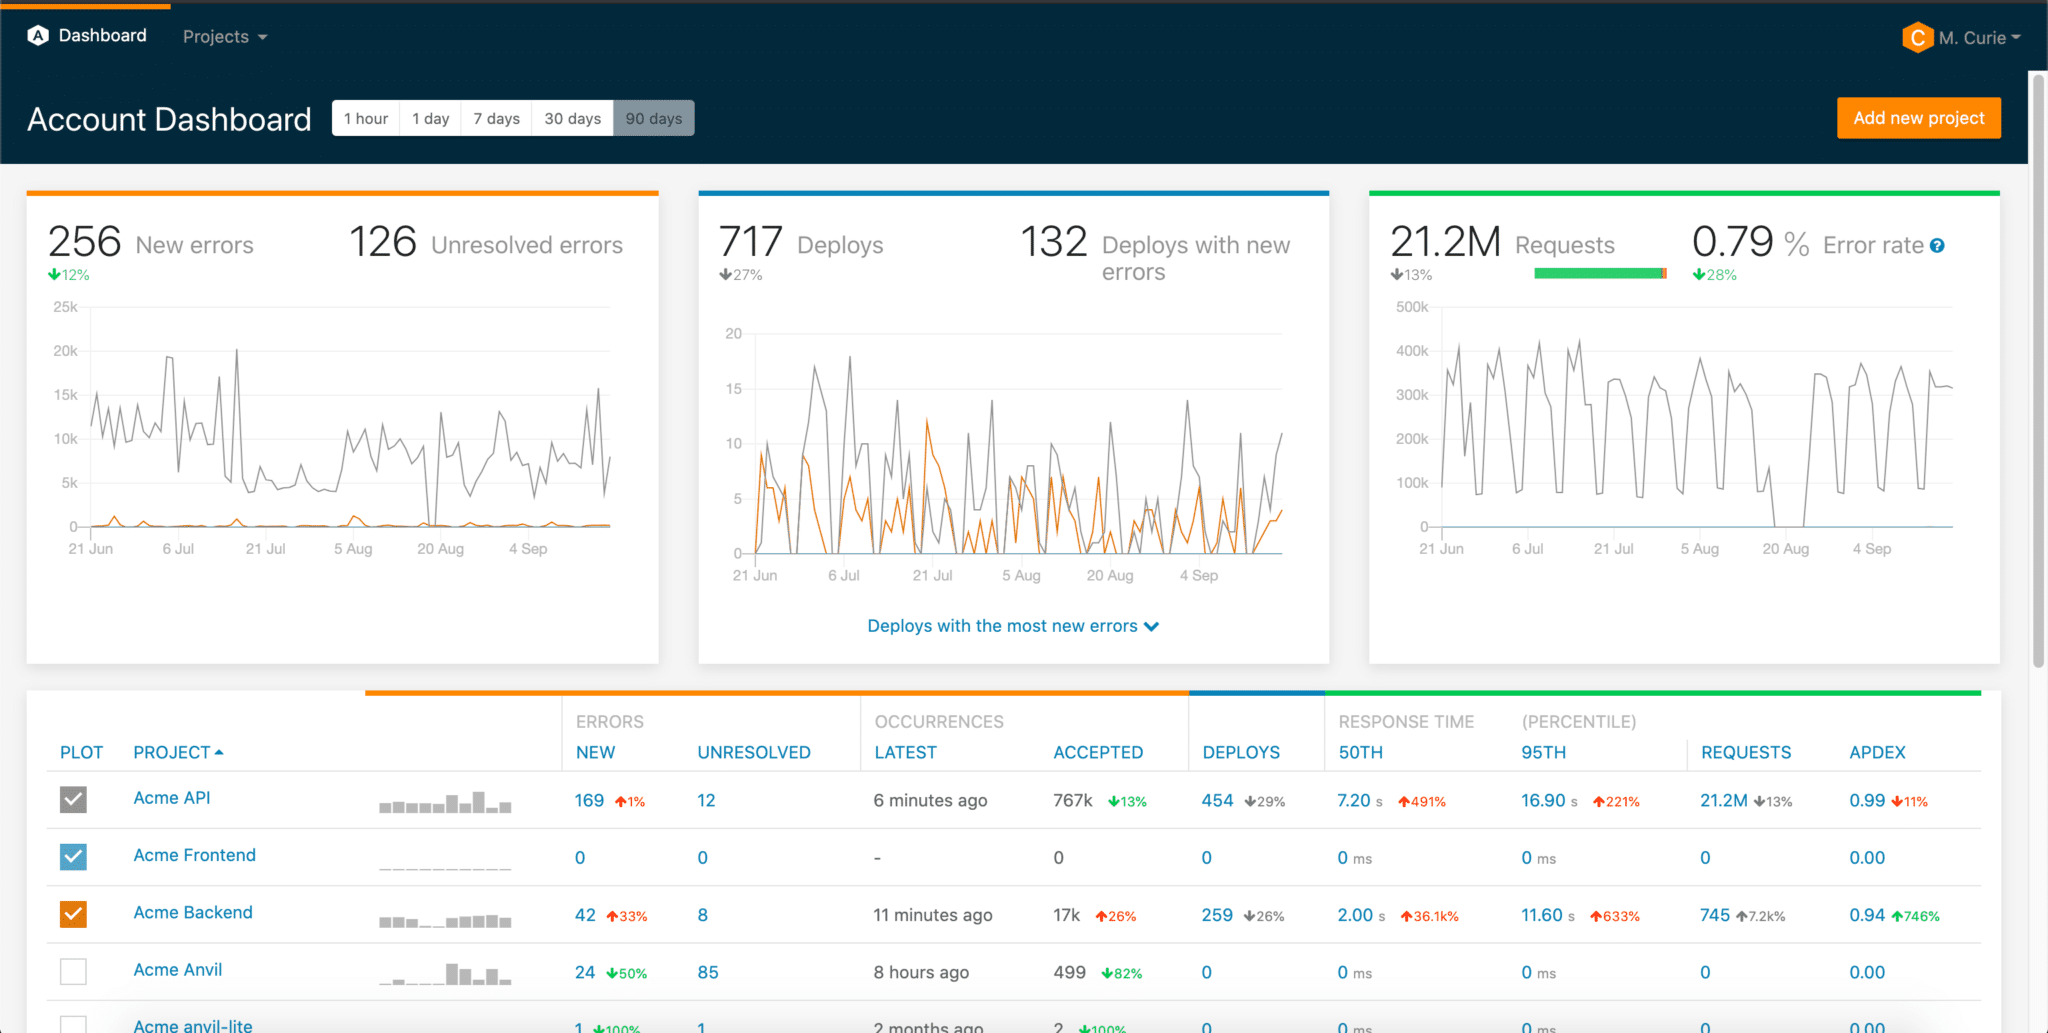
Sentry is an error tracking and performance monitoring tool that can diagnose and resolve JavaScript issues. The service compiles your mistakes into a searchable list and allows you to identify areas of your code to make it easier to reproduce errors.
Key Features:
- Bug Tracking: Tracks bugs and compiles them into a searchable list for easy identification and resolution.
- Fault Aggregation Workflows: Streamlines error detection and resolution workflows through fault aggregation and analysis.
- Performance Monitoring: Monitors application performance to identify and address performance issues promptly.
- Log Data Insights: Provides insights into log data to facilitate error diagnosis and resolution.
- Free with Premium Options: Offers a free version with premium options, including enhanced error detection algorithms and insights.
Why do we recommend it?
Sentry earns our recommendation as a robust error tracking and performance monitoring tool designed to diagnose and resolve JavaScript issues effectively. Its comprehensive features, including bug tracking, fault aggregation workflows, and performance monitoring, make it invaluable for developers striving for software reliability and performance optimization. With its user-friendly interface and stack tracing tool, Sentry empowers developers to identify and debug errors swiftly, enhancing code quality and user experience.
The performance monitoring tools can help you diagnose problems in your development projects by allowing you to spot unusual readouts quickly. In addition, a stack tracing tool simulates your development environment, enabling you to debug discovered mistakes and better understand where bugs are occurring in the code.
Who is it recommended for?
Sentry is highly recommended for developers and development teams seeking a dedicated solution for error tracking and performance monitoring. It is particularly suitable for companies already using other application monitoring tools and looking to enhance their error detection and resolution capabilities. While it may be better suited for smaller teams, Sentry's scalable pricing options cater to the needs of teams of all sizes, making it accessible to developers across various industries and development environments.
Pros:
- Dedicated to Monitoring Various Languages: Focuses on monitoring various languages, making it suitable for companies with diverse tech stacks and monitoring needs.
- Customizable Alerts and Templates: Provides 100+ alerts and templates customized around server health monitoring, ensuring proactive error detection and resolution.
- Supports Root Cause Analysis: Facilitates root cause analysis for faster resolution times, improving overall software reliability.
- Includes Workflows for Better Root Cause Analysis: Offers workflows designed to enhance root cause analysis, streamlining error diagnosis and resolution processes.
Cons:
- Better Suited for Smaller Teams: While suitable for teams of all sizes, Sentry may be better suited for smaller teams due to its pricing structure and feature set. However, its scalable pricing options make it accessible to teams of all sizes.
Sentry's primary capabilities are entirely free to use with a limited user capacity. Upgrade to the Team package for $26/month, which increases the error detection algorithms, or the Business package for $80/month, which expands the error insights even more.
A free trial is offered for both the Team and Business editions. If you approach Sentry directly, Enterprise size services are available if you require large-scale considerations such as complete platform error monitoring and cross-project insights.
4. Glitchtip
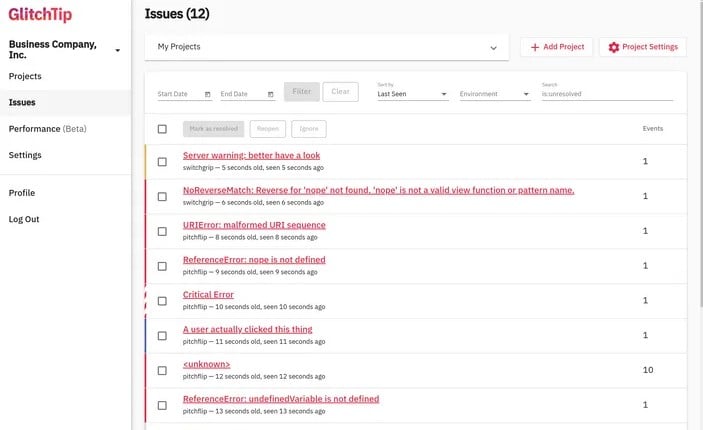
Glitchtip is an open-source bug reporting application that collects and organizes problem reports into a legible, fixable format. The solution appears to have been developed in response to Sentry's decision to abandon open-source, but it still works with Sentry's open SDK.
Key Features:
- Bug Aggregation: Collects and organizes problem reports into a legible, fixable format, streamlining bug resolution workflows.
- Open-Source: Developed as an open-source alternative to proprietary bug reporting solutions, offering transparency and flexibility.
- Performance Monitoring: Monitors application performance to identify and address performance issues promptly.
- Integration with Sentry SDK: Integrates seamlessly with Sentry SDK, ensuring compatibility with existing workflows and toolchains.
- Self-Hosting Options: Offers self-hosting options for organizations seeking full control over their bug reporting infrastructure.
Why do we recommend it?
Glitchtip receives our recommendation as an open-source bug reporting application designed to collect and organize problem reports effectively. Developed in response to the need for an open-source alternative to proprietary solutions like Sentry, Glitchtip offers robust features, including bug aggregation, performance monitoring, and integration with Sentry SDK. Its commitment to transparency and self-hosting options make it an ideal choice for organizations prioritizing control and flexibility in their bug reporting processes.
You can host the solution locally because it is open source, but the company also provides hosting choices. In addition, it outperforms other alternatives because it is open source, which means it has a larger community of users than some other products. Glitchtip is still in its infancy, but it could be the ideal answer for tiny enterprises or low-budget projects that require open source.
When self-hosted, Glitchtip is open source and entirely free. You can also use their hosted platform for free up to 1000 events. They offer services for small, medium, and large businesses in addition to the free hosted alternative.
Who is it recommended for?
Glitchtip is recommended for organizations of all sizes seeking an open-source bug reporting solution. While it may be particularly appealing to small enterprises or low-budget projects, Glitchtip's self-hosting options and scalability make it suitable for a wide range of businesses. Whether you prefer self-hosting or using their hosted platform, Glitchtip offers flexibility and affordability, making it accessible to developers and organizations across various industries.
Pros:
- Completely Open Source and Transparent: Offers a completely open-source and transparent bug reporting solution, providing visibility into its codebase and development process.
- Includes Self-Hosting Options: Provides self-hosting options for organizations prioritizing control and security over their bug reporting infrastructure.
- Free for up to 1000 Events: Offers a free hosted platform for up to 1000 events, making it accessible to small projects and low-budget initiatives.
- Supports a Range of SDK Integrations: Supports a range of SDK integrations, ensuring compatibility with various development environments and toolchains.
Cons:
- Could Benefit from More Visual Dashboards: While functional, Glitchtip could benefit from more visually appealing dashboards and user interfaces to enhance usability and user experience.
- Open Source Isn't Always Best for Larger Organizations: While open-source solutions offer transparency and flexibility, they may not always meet the specific needs of larger organizations with more complex requirements and regulatory compliance concerns.
The Small package is $15 per month and supports up to 100k events. The Medium package costs $50 per month and supports up to 500k events. Finally, the Large package costs $250 per month and supports up to 3 million events.
5. Raygun
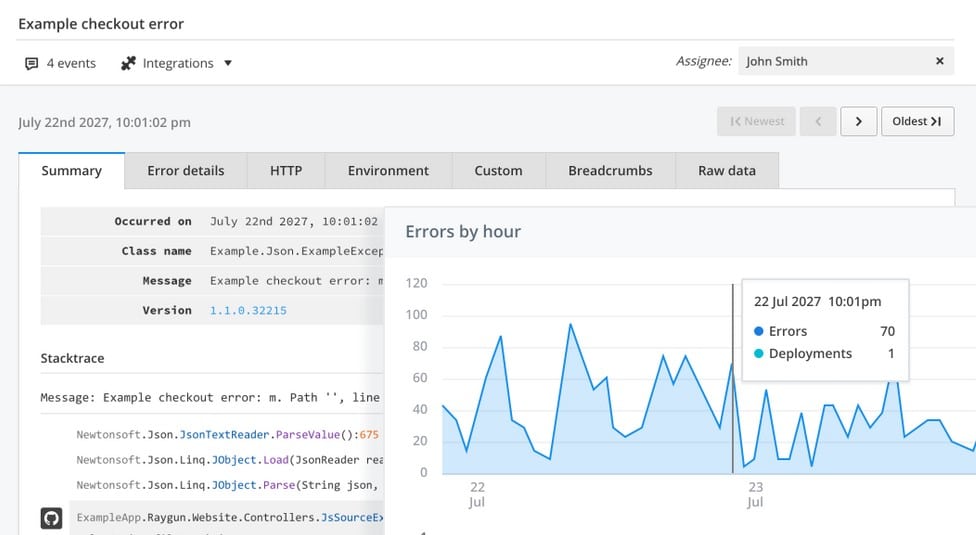
Raygun aggregates user data to enable accurate crash reporting and bug feedback. The solution splits its primary functions into three different products. This means you can opt into the services you need, which provide a customized product.
Key Features:
- Error Reporting and Feedback: Identifies and address issues promptly.
- User Monitoring: Monitors user behavior and interactions to gain insights into application performance and user experience.
- Crash Report Diagnostics: Pinpoints the root cause of issues and facilitate resolution.
- Inbuilt Bug-Fixing Information: Streamlines the debugging process and enhance productivity.
- Customizable Purchase Options: Provides customizable purchase options, allowing users to tailor their experience based on their specific needs and budget.
Why do we recommend it?
Raygun earns our recommendation as a versatile solution for accurate crash reporting and bug feedback. With its customizable product offerings, Raygun allows users to tailor their experience by opting into the services they need, ensuring a personalized and efficient bug tracking process. Its key features, including error reporting, user monitoring, crash report diagnostics, and inbuilt bug-fixing information, make it an indispensable tool for developers striving for software reliability and performance optimization.
The solution includes issue-tracking tools as well as debugging mitigation solutions. These features, combined with user data monitoring, make this solution ideal for debugging an existing operational service.
Who is it recommended for?
Raygun is recommended for developers and development teams seeking a comprehensive solution for crash reporting and bug feedback. While it may be better suited for real user monitoring use cases, Raygun's intuitive visual debugger and robust features make it suitable for a wide range of development environments. Whether you're debugging an existing operational service or optimizing performance for a new application, Raygun offers the tools necessary to streamline bug tracking and resolution processes effectively.
Pros:
- Simple Visual Debugger: Offers a simple and intuitive visual debugger, enhancing the debugging experience for developers.
- Offers Crash Reporting and Bug Feedback: Provides comprehensive crash reporting and bug feedback mechanisms, ensuring prompt issue identification and resolution.
- Supports User Monitoring: Monitors user behavior and interactions, providing valuable insights into application performance and user experience.
Cons:
- Better Suited for Real User Monitoring Use Cases: While suitable for a wide range of development environments, Raygun may be better suited for real user monitoring use cases due to its focus on user behavior and interactions.
The solution is divided into three primary services, which can be tried for free on the website. In addition, your monitoring needs will benefit from the Application Performance Monitoring and Real User Monitoring packages, which start at $8 per month.
The correct JavaScript debugging tools can be found in the Error Monitoring & Crash Reporting application, which costs $4 per month. Similarly, the price for each product is scalable based on the required capacity, with 10,000-unit increments being typical.
6. Rollbar
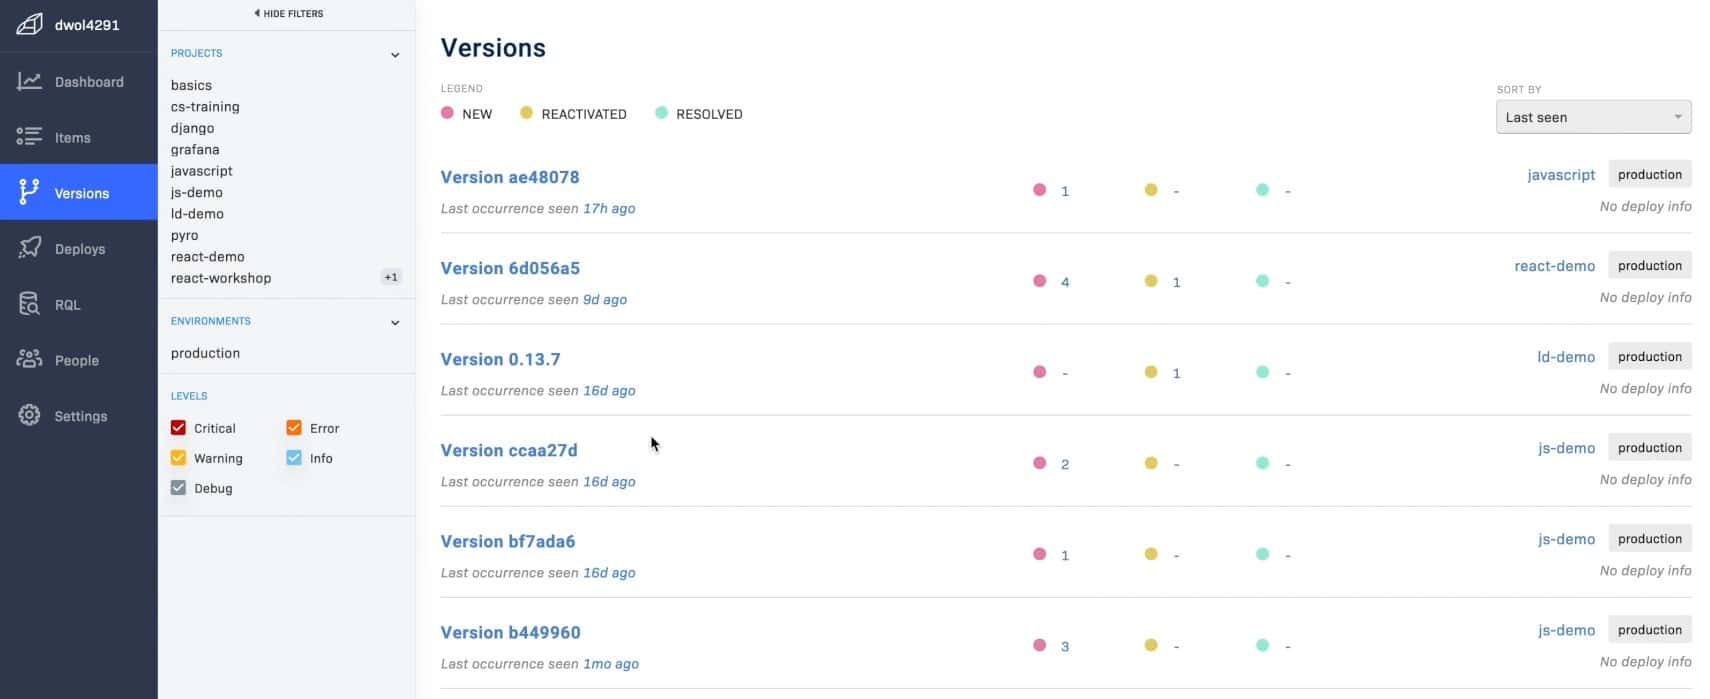
Rollbar is an error reporting and fault aggregation solution based on real-time issue identification. You can trace bugs emerge using telemetry data obtained through the various integrations available, which speeds up bug repair.
Key Features:
- Error Tracking and Aggregation: Tracks errors and aggregates them in real-time, providing valuable insights into application stability and performance.
- Bug Report Management: Manages bug reports efficiently, ensuring prompt identification and resolution of issues.
- Workflow/VCS Integration: Integrates seamlessly with workflow and version control systems, enhancing collaboration and streamlining issue resolution workflows.
- Bug Notification Tools: Provides notification tools for quick and accurate reporting of bugs, enabling timely action and resolution.
- Free with Premium Options: Offers a free version with premium options, providing flexibility and scalability to meet the needs of different-sized organizations.
Why do we recommend it?
Rollbar earns our recommendation as an efficient error reporting and fault aggregation solution that prioritizes real-time issue identification. Its key features, including error tracking, bug report management, workflow/VCS integration, and bug notification tools, make it invaluable for developers striving to maintain software quality and reliability. With its focus on automated issue tracking and workflow triggers, Rollbar streamlines the bug repair process, ensuring prompt resolution and minimizing the risk of shipping projects with untreated defects.
Automated issue tracking and workflow triggers help you avoid accidentally shipping projects with known but untreated defects. The solution includes a set of notification tools for quick and accurate issue reporting and the ability to categorize bug notifications for easier reading intelligently.
Who is it recommended for?
Rollbar is recommended for developers and development teams seeking a comprehensive solution for error reporting and bug management. While it may be better suited for larger environments, Rollbar's support for real-time bug discovery and analysis, along with its extensive integration options, make it suitable for organizations of all sizes. Whether you're a small startup or a large enterprise, Rollbar offers the tools necessary to streamline bug detection, diagnosis, and resolution processes effectively.
Pros:
- Supports Real-Time Bug Discovery and Analysis: Prioritizes real-time issue identification, enabling developers to identify and address bugs promptly.
- Supports Various Integrations for Practically Any Workflow: Integrates with various tools and services, ensuring compatibility with different development environments and workflows.
- Free for Up to 25,000 Error Events: Offers a generous free tier, allowing users to experience the benefits of Rollbar without committing to a paid plan immediately.
Cons:
- Better Suited for Larger Environments: While suitable for organizations of all sizes, Rollbar may be better suited for larger environments due to its extensive feature set and scalability. However, its flexibility and customization options make it accessible to organizations of all sizes.
Rollbar is free for up to 25,000 error events and has enough basic capabilities to get you started, especially if you're working in a small development team.
The Essentials plan, which costs $21 per month and covers up to 50,000 error events, is included in the premium plans. The Advanced plan allows for up to 100k error occurrences and a multi-project feed with combined monitoring.
7. Komodo IDE
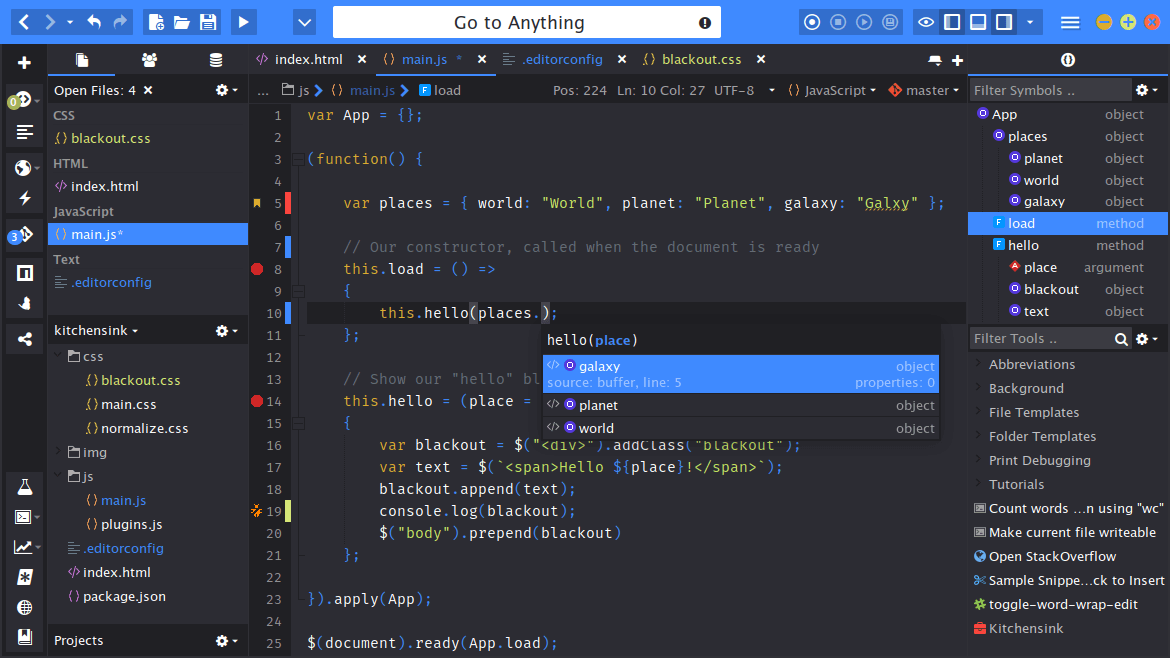
Komodo is an IDE that supports a wide range of languages, including JavaScript. Komodo is open source, and the base product is available for free. The true allure of Komodo is its open-source foundations, which means it has a lot of support and extension options.
Key Features:
- Visual Debugger: Facilitates debugging and error identification, enhancing developer productivity.
- Open-Source Platform: Built on open-source foundations, offering extensive support and extension options for customization and flexibility.
- CI/CD Integrations: Integrates seamlessly with CI/CD pipelines, streamlining the development and deployment process.
- Git Integrations: Offers built-in support for Git, enabling version control and collaborative development workflows.
- Multi-Language Support: Supports multiple languages, including JavaScript and Python, catering to the diverse needs of developers.
Why do we recommend it?
Komodo IDE earns our recommendation as a versatile Integrated Development Environment (IDE) that supports a wide range of languages, including JavaScript. Its open-source foundations and extensive feature set make it a compelling choice for developers seeking a powerful and customizable development environment. With key features such as a visual debugger, CI/CD integrations, Git integrations, and support for multiple languages, Komodo IDE offers developers the tools they need to streamline development workflows and enhance productivity.
This solution will provide numerous features to boost your debugging capabilities if you require a new IDE for Python development. The IDE’s In addition, the visual debugger and code inspection capabilities excel at debugging, improving error identification, and preventing problems. In addition, you can avoid defective builds from being distributed thanks to built-in support for VCS like Git and workflow management solutions.
Who is it recommended for?
Komodo IDE is recommended for developers and development teams seeking a feature-rich and customizable IDE for their development projects. Whether you're working with JavaScript, Python, or other languages, Komodo IDE provides the tools and flexibility necessary to meet your development needs. While it may be particularly appealing to developers who value open-source solutions and extensive support and extension options, Komodo IDE is suitable for developers of all skill levels and project requirements.
Pros:
- Includes Python Tools as Well as Support for Multiple Languages: Offers tools and support for multiple languages, including Python, making it suitable for a wide range of development projects.
- Open Source-Based Tool: Built on open-source foundations, providing developers with extensive support and extension options for customization and flexibility.
- Supports Visual Debugging: Provides a visual debugger to facilitate debugging and error identification, enhancing developer productivity.
Cons:
- Not Ideal for Those Looking to Avoid Open-Source Solutions: While suitable for developers who value open-source solutions, Komodo IDE may not be ideal for those seeking proprietary or closed-source development environments. However, its open-source nature provides developers with extensive support and customization options.
The program may be downloaded and installed on the company's website, but to use it, even the free version, you'll need an ActiveState account.
Because the IDE is free and open-source, it's worth considering if you're on a budget and need a solution. However, keep in mind that it appears to be fading in popularity and support while the product is still supported.
8. Visual Studio
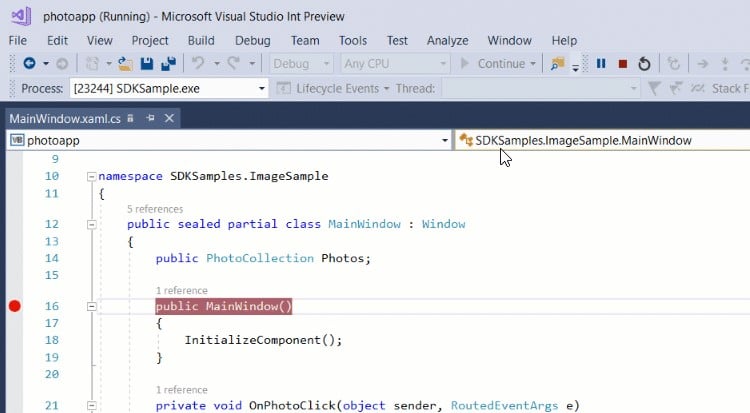
Visual Studio is an IDE with one of the most comprehensive debugging toolkits available. When it comes to addressing bugs, Visual Studio's suite of debugging features means it can compete with any other IDE. In addition, visual Studio can support a vast number of languages; therefore, the usability isn't limited to JavaScript.
Key Features:
- Visual Debugger: Comprehensive debugging features, enabling developers to identify and address bugs effectively.
- Debugging Tools: Includes breakpoints and step sequences, to isolate and diagnose code issues efficiently.
- Multi-Language Support: Including JavaScript, Python, and others, catering to the diverse needs of developers.
- Workflow Integrations: Integrates seamlessly with workflow tools, enhancing collaboration and streamlining development processes.
Why do we recommend it?
Visual Studio earns our recommendation as an IDE with one of the most comprehensive debugging toolkits available, making it a top choice for developers seeking powerful debugging capabilities. With its suite of debugging features and support for multiple languages, including JavaScript, Visual Studio offers developers the tools they need to identify and address bugs effectively. Its extensive integration options and popularity in the developer community further enhance its appeal, ensuring a seamless development experience for developers of all skill levels.
Breakpoints can isolate individual lines of code that are creating problems, and visual debugging tools can be used to diagnose and mitigate concerns. You can also use the debugging tool in step sequences to figure out which line of code is causing the issue.
Who is it recommended for?
Visual Studio is recommended for developers seeking a robust and feature-rich IDE for their development projects. Whether you're working with JavaScript, Python, or other languages, Visual Studio provides the tools and flexibility necessary to meet your development needs. While it may be particularly appealing to developers who value comprehensive debugging capabilities and extensive language support, Visual Studio is suitable for developers of all skill levels and project requirements.
Pros:
- Supports Python and Other Languages: Offers support for multiple languages, including Python, making it suitable for a wide range of development projects.
- One of the Most Popular IDEs on the Market: Known for its popularity and widespread adoption in the developer community, ensuring extensive support and resources.
- Features a Visual Debugger: Comprehensive debugging capabilities, enhancing developer productivity and efficiency.
Cons:
- Not an Ideal Alternative: While suitable for developers who value its features and capabilities, Visual Studio may not be ideal for those seeking alternatives to the Visual Studio environment.
Visual Studio is available in various versions, including the Community version, a free, open-source version targeted for individual small-scale developers.
If you operate in a group, you might want to look into the Business options available as part of a $45 per month subscription. For $250 per month, Enterprise services are available for large-scale commercial needs.
9. JS Bin
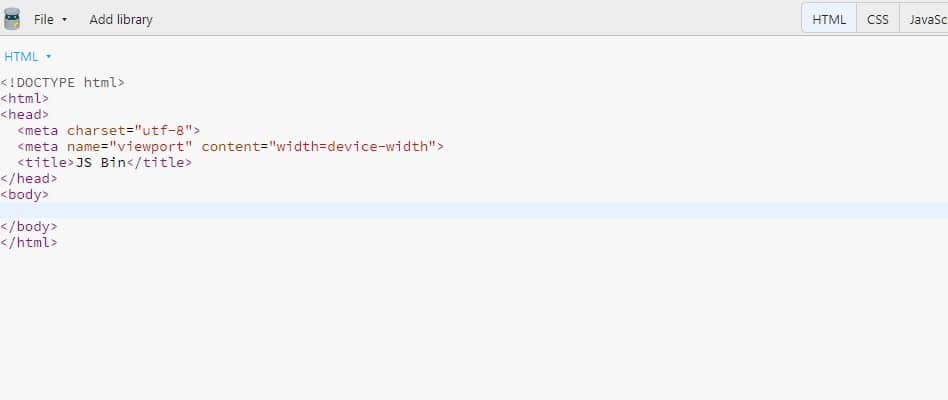
JS Bin is a straightforward and free JavaScript debugging tool. However, it provides limited features and no accurate monitoring capabilities. Still, the simplicity, debugging features, and lack of associated costs make this tool excellent for small or solo JavaScript developers who just need to check their code quickly.
Key Features:
- JavaScript Debugging Suite: Facilitates efficient code debugging and testing.
- Github Exporting Tools: Seamless integration with version control systems and collaborative workflows.
- Templating Features: Streamlines code development and improve productivity.
- Dropbox Backup Sync: Easy backup and synchronization of coding projects.
- Collaborative Features: Facilitates collaboration among multiple developers by allowing them to interact with the same code and project.
Why do we recommend it?
JS Bin earns our recommendation as a straightforward and free JavaScript debugging tool ideal for small or solo developers who need to check their code quickly. While it may offer limited features compared to competing products, its simplicity, debugging features, and lack of associated costs make it an excellent choice for developers looking for a lightweight and budget-friendly solution. With collaborative features and integration options like Github exporting and Dropbox backup sync, JS Bin enhances productivity and facilitates seamless collaboration on coding projects.
The utility has collaborative features that allow multiple developers to interact with the same code. Still, unless you pay a premium for a ‘private bin,’ your code is technically exposed to the public. The project is entirely open source and primarily funds itself through donations and Pro subscriptions.
Who is it recommended for?
JS Bin is recommended for small or solo JavaScript developers seeking a simple and lightweight debugging tool. Whether you're working on personal projects or collaborating with a small team, JS Bin provides the essential features necessary for efficient code debugging and testing. While it may not offer advanced monitoring capabilities or extensive feature sets, JS Bin's user-friendly interface and cost-effective pricing make it suitable for developers looking for a budget-friendly solution without compromising on functionality.
Pros:
- Extremely Lightweight Tool: Lightweight and easy to use, making it ideal for quick code checking and debugging.
- Includes a Dropbox Sync Integration: Easy backup and synchronization of coding projects, enhancing data security and accessibility.
- Best for Small Teams and Projects: Provides essential features necessary for efficient code debugging and testing.
- Completely Open Source: Offers transparency and flexibility, allowing developers to customize and extend its functionality as needed.
Cons:
- Limited Features Compared to Competing Products: While functional, JS Bin may offer limited features compared to competing products, particularly for developers with more advanced requirements.
- More of a Budget Tool: Catering more to developers looking for a cost-effective solution without extensive feature sets or advanced monitoring capabilities. However, its simplicity and affordability make it an attractive option for small or solo developers.
JS Bin is entirely free and open source. There is a Pro subscription available for $126 per year or $16 per month. The Pro version removes any capacity limits in place and adds the ability to create private workspaces for secure collaboration.
10. Selenium
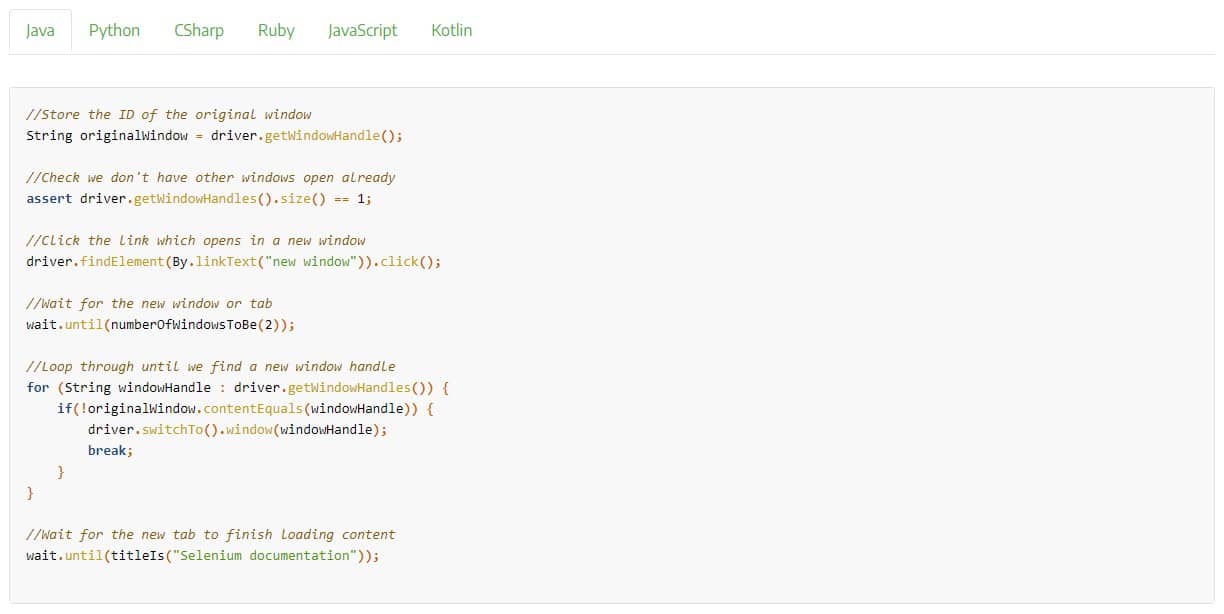
Selenium is an open-source testing framework that can help you reduce bugs by automating JavaScript web testing. Selenium provides a basic framework with no interface and requires advanced foundational programming knowledge.
Key Features:
- Scripted Web Automation Testing: Allows developers to automate testing workflows and ensure software quality.
- Development IDE: Enables developers to create and execute tests efficiently.
- Multi-Environment Management: Facilitates multi-environment management, allowing developers to manage testing across various environments seamlessly.
- Browser Interaction Record-and-Playback: Simplifies the process of creating and executing test scripts.
- Open Source and Free: Offers accessibility and flexibility, making it a cost-effective solution for testing needs.
Why do we recommend it?
Selenium earns our recommendation as an open-source testing framework that excels in automating JavaScript web testing, helping developers reduce bugs and streamline testing processes effectively. While it requires advanced foundational programming knowledge, its robust features, including scripted web automation testing, development IDE, multi-environment management, and browser interaction record-and-playback, make it a valuable tool for developers seeking to automate testing workflows and ensure software quality. With its lightweight nature, flexibility, and integration with various CI/CD platforms, Selenium offers a comprehensive solution for web testing needs.
Selenium's three main functionalities are web automation testing, a development IDE for test scripts, and a central management point. All essential functions are available for free and fully integrated into various CI/CD platforms.
Who is it recommended for?
Selenium is recommended for developers and QA engineers with advanced technical skills seeking a powerful and customizable testing framework for JavaScript web testing. While it may require advanced programming knowledge to utilize effectively, Selenium's flexibility and extensive feature set make it suitable for developers looking to automate testing processes and enhance software quality. Whether you're testing virtual environments, public or private cloud properties, Selenium provides the tools necessary to streamline testing workflows and reduce bugs effectively.
Pros:
- Lightweight Tool: Uses minimal system resources, ensuring efficient performance without impacting system performance.
- Extremely Flexible and Highly Customizable: Offers flexibility and customization options, allowing developers to tailor testing workflows to their specific requirements.
- Features Enterprise Access Controls: Ensures secure and controlled access to testing resources and environments.
- Tests Virtual Environments: Supports testing of virtual environments, public and private cloud properties, catering to diverse testing needs.
Cons:
- More of a Technical Tool: Requires advanced technical skills and programming knowledge, making it better suited for developers and QA engineers with technical expertise. However, its comprehensive documentation and community support resources can help developers overcome this challenge and leverage its full potential.
You can download Selenium from the website for free. Selenium Webdriver is the web automation testing suite and supports JavaScript. Selenium IDE provides the script creation platform with browser integration and supports Chrome, Firefox, and Edge.
Finally, Selenium Grid is the management and multi-environment orchestration platform and must be installed on a central server to be installed on. While you don’t need Selenium Grid for your CI/CD pipeline, it will likely be worthwhile for the full integration.
In Summary
This article discusses several tools that you can use to monitor and debug your JavaScript development projects. Most of which can be split between pre-deployment and post-deployment solutions, with post-deployment solutions being heavily focussed on the monitoring side of the debugging process.
Pre-deployment debugging is heavily reliant on your IDE. We have recommended a few IDEs in this article that can massively overhaul your debugging abilities during development. Namely, Komodo IDE and Visual Studio are two of the best IDEs out there for debugging JavaScript.
Other tools can assist you before deployment that isn’t specifically IDEs. Two we have included on this list are the Selenium testing framework and JS Bin. Selenium can be used to rigorously test your JavaScript web projects to catch bugs through automation. At the same time, JS Bin simulates a collaborative IDE with the main focus being on catching bugs.
Post-deployment bug fixing is mainly about bug monitoring, reporting, and aggregation. We’ve covered several error-reporting solutions in this article, such as Airbrake, Glitchtip, and Rollbar. These error-reporting solutions allow your team to identify bugs from testers and end-users and convert the data into actionable tasks.
Overall, if you want to cover your bases, your best choice is to combine a debug-focused IDE with an error-reporting solution. This will help you catch bugs in the net before deployment and provide you with the best insight into where your bugs exist and how to fix them after your product has been shipped.