We may earn a commission if you make a purchase through the links on our website.
The Best Operating System Monitoring Software
UPDATED: July 31, 2024
“Everything fails all the time” –Werner Vogels, Vice President & Chief Technology Officer at Amazon.com
Vogels believes that it is not possible to run a service 100% all the time – Systems Just Fail.
Running infrastructure, services, and applications that require a guaranteed up-time tend to be a complex game. We simply cannot have a perfect and ideal system, but we can try to tell when something is about to happen and do something about it.
This is where Operating System Monitoring Tools and Software come into play.
Here is our list of the best Operating System Monitoring Software:
- Paessler PRTG – FREE TRIAL This package of monitors for servers, networks, and applications can be tailored and it includes sensors that watch over operating systems. Start a 30-day free trial.
- Site24x7 Server Monitoring – FREE TRIAL This cloud-based system is able to watch over endpoints running and it can also monitor cloud platforms and SaaS packages. Start a 30-day free trial.
- ManageEngine OpManager – FREE TRIAL Monitors networks and servers and that includes operating system monitoring. Available for Windows Server and Linux. Download a 30-day free trial.
- Nagios XI Monitors Windows and Linux operating systems as well as server resources, applications, and networks. Runs on Linux and will run on Windows over a hypervisor.
- Quest Foglight Evolve This package can monitor on-premises and cloud servers as well as virtualization. Runs on Windows Server or Linux.
- EventSentry This package is a performance and security monitor that includes a log manager and it will watch over the performance of your server operating systems. Runs on Windows Server.
- Zenoss Monitore operating systems as well as other server resources plus networks and applications with this flexible package. Runs on Linux.
- ITRS OP5 Monitor This system monitoring package will watch over all of the resources of your servers, including operating systems and it also monitors networks. Available for Linux.
Although computers are designed to check their own resources periodically and self-heal, sometimes unexpected code errors in software or high temperature due to malfunctioning hardware can impact a system’s resources.
The need to implement an all-in-one OS “Operating System” monitoring software and solution is necessary to minimize those failures. An OS Monitoring Tool will collect periodic information from core components, analyze it and display the results in real-time graphics. As soon as an event is triggered, they will alert you so you can work on the problem.
Which Operating Systems can be Monitored:
A comprehensive monitoring tool can help you test the performance in different types of Operating Systems and Servers, such as:
- Windows XP, Vista, 7, 8, 10, 2008 Server, 2012 Server, 2016 Server, Linux, UNIX, and Mac Osx.
- Windows WMI (Exchange Server and Microsoft SQL Server).
- Redhat Enterprise Linux, Suse Linux Enterprise Server, CentOS, etc.
- Others: Citrix XenServer, Hyper-V Server, etc.
System Components & Metrics to Monitor:
Desktop or Server OS monitoring basically relies on checking services, event logs, and performance counters. System Monitoring tools should be able to gather and display the following system metrics:
- CPU Utilization: A process can either reduce or increase the CPU overall consumption. A process could enter a hung state due to errors in the code and increase the usage of the CPU, leading to a potential rise in temperature.
- Network Monitoring: A faulty network adapter, incorrect switch settings, protocol failures or faulty hardware can affect the network bandwidth and even entire traffic in the network.
- Memory: Excessive memory usage could also impact an OS. For example, too much cache usage (% of memory) can lead to a performance crash.
- Physical Disk: High average response times could indicate a faulty physical disk. Swapping to available partitions and freeing space on the volume are common responses.
- Event logs: These are the records for your network security. If something is suspicious or if there is an error, the logs will register the event in the background.
- OS Services: A monitoring tool can alert you when a critical service is paused, running, stopped or terminated. Some important services to check in a Windows Server are Active Directory, DHCP, Sendmail, Plug and Play Service.
- Applications: Some monitoring tools are tailored to check on the app itself, such as Apache, MySQL, IIS, etc.
and any other important features of an Operating System that needs to be carefully managed and monitored (Registry, Systems Files, etc).
The Best OS Monitoring Software & Tools
Our methodology for selecting OS monitoring tools and software
We reviewed the operating system monitoring tools and software market and analyzed the options based on the following criteria:
- An autodiscovery system to log all network devices
- A network topology mapper
- The ability to collect live network devices statuses
- A facility to analyze network performance over time
- A free trial period, a demo, or a money-back guarantee for no-risk assessment
- A good price that reflects value for money when compared to the functions offered
Below you'll find a quick description of each Software suite as well as a few screenshots of their Dashboards, Cost/Pricing and Download links for each.
1. Paessler PRTG – FREE TRIAL
PRTG by Paessler is another Industry Titan in the Network Monitoring and Management realm, but they also do well in monitoring specific operating system vitals, services and critical components.
Key Features:
- Flexible Package of Monitoring Tools: Choose which of the contents of the PRTG bundle to activate and ignore the rest
- System Discovery: The tool scours the network and generates a hardware inventory
- Automatic Network Topology Map: See how all of the network devices and endpoints on your network link together
- Live Monitoring for OSs and VMs: Windows, Linux, macOS, Hyper-V, and VMware
Why do we recommend it?
Paessler PRTG is a vast package of monitoring tools and no buyer will even need to use all of them. There are targeted screens and probes that focus on specific technologies in the pack, so you just activate those monitors for the systems that you have. This strategy avoids the console menu being cluttered with functions that you will never use.
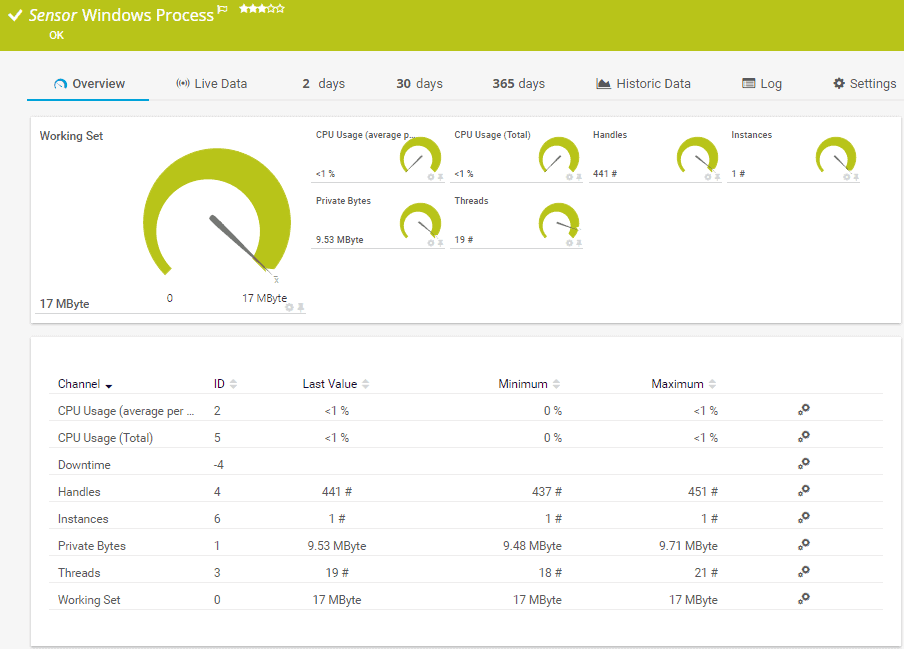
PRTG Monitors the following Operating Systems:
- Windows (CPU, Traffic, Memory, Hard-drives and more)
- Linux (via SNMP and SSH)
- Max OSX (via SNMP)
- Sonicwall, IBM and Hyper-V and VMWare
As you can see, PRTG is very flexible and has really made an effort to cover as many OS's as possible in their Management and Monitoring Platform.
Who is it recommended for?
This package is suitable for all sizes and types of companies because it is so flexible. Pay only for the sensors that you use; businesses that only activate up to 100 sensors never have to pay for the package. The PRTG system is available for Windows Server and it is also offered as a SaaS platform in the cloud.
Pros:
- Monitors Hybrid Systems: Both cloud and on-premises assets
- Tracks Server Activity: Including operating system monitoring
- Server Capacity Observations: Notes the full potential capacity of each resource alongside current utilization
- Alert for System Resource Shortages: Get them forwarded as notifications by email or SMS
Cons:
- Not Available for Linux: Businesses that don’t have a computer running Windows Server will need to opt for the SaaS version
They have a FREE 100 Sensor Fully Functional download as well, so head over to their Site below and download today!
The first 100 Sensors Free! Start a 30-day free trial with unlimited sensors.
2. Site24x7 Server Monitoring – FREE TRIAL
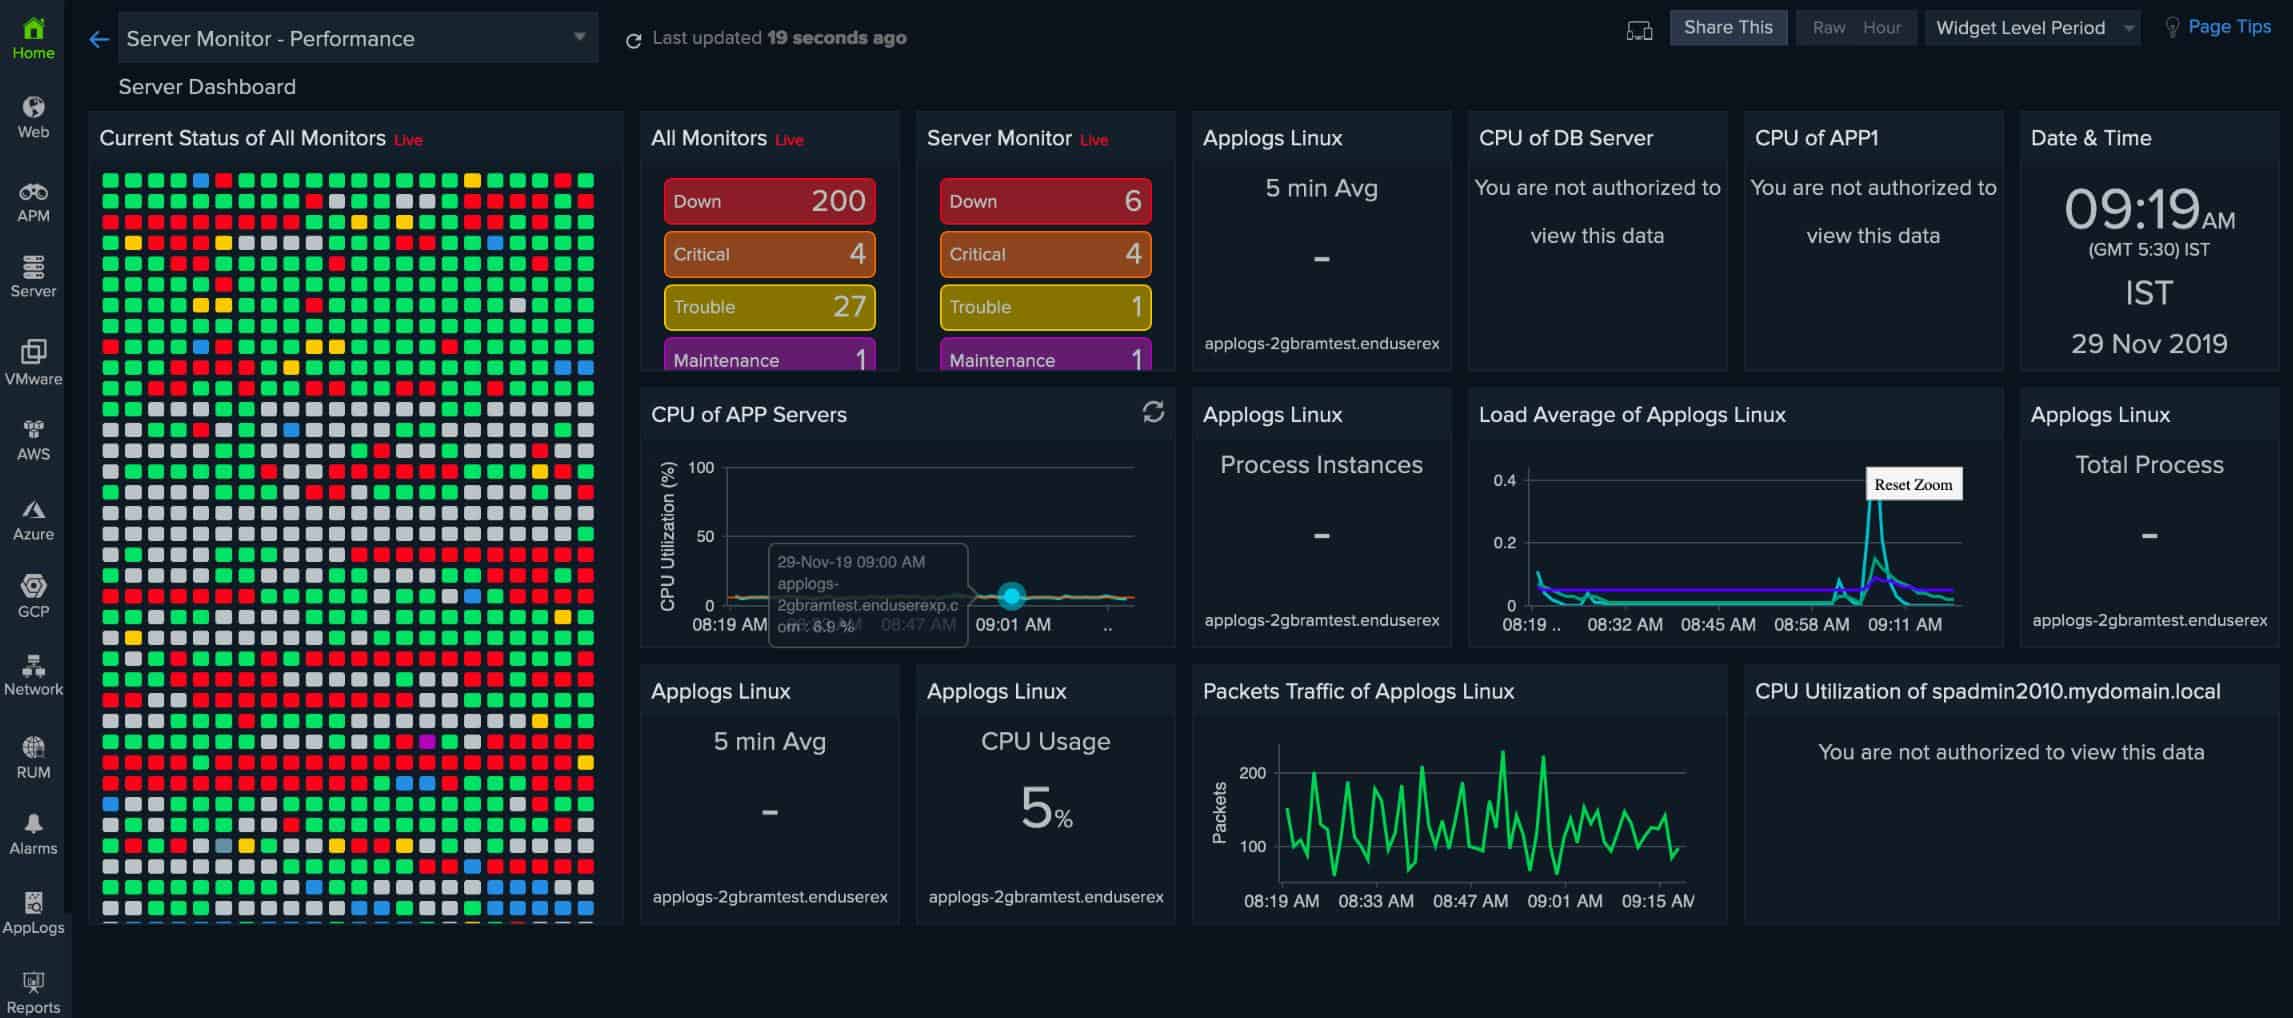
Site24x7 Server Monitoring provides supervision for on-premises servers and cloud platforms. It can also watch over the performance of VMware and Hyper-V virtualizations, AWS and Azure platforms, Docker, and Microsoft products, such as IIS, SQL Server, and Office 365.
Key Features:
- Server and Virtual Server Monitoring: Windows, Windows Server, Linux, AWS, and Azure
- Virtualization Monitoring: VMware and Hyper-V
- Container Monitoring: Docker and Kubernetes
Why do we recommend it?
Site24x7 Server Monitoring is part of a full stack observability package that is hosted in the cloud. This system reaches out to protected systems through the installation of agents. The server monitoring feature is linked to other services in the platform that provide application monitoring. The tool offers application dependency mapping to aid with root cause analysis.
The on-premises servers that this package monitors can be running Windows, Windows Server, and the Debian, Ubuntu, CentOS, RedHat, Madriva, CoreOS, Fedora, Suse, Gentoo, and Raspberry Pi distros of Linux.
Who is it recommended for?
Site24x7 offers plans that include all of the modules on the platform. So, you get network, server, and application monitoring all together. All plans are sized and priced to be suitable for small businesses. Larger organizations pay for capacity expansion, so the system can cater to companies of all sizes.
Pros:
- Server Discovery and Automatic Agent Installation: Also implements network discovery
- Live Monitoring of Server Resources: Linked to software activity and application demand for resources
- System Documentation: Generates hardware and software inventories
Cons:
- No On-Premises Version: Only available as a cloud-based SaaS platform
Site24x7 Server Monitoring is part of the Infrastructure plan, which costs $9 per month (when paid annually) to monitor up to 10 servers. Get a 30-day free trial.
3. ManageEngine OpManager – FREE TRIAL
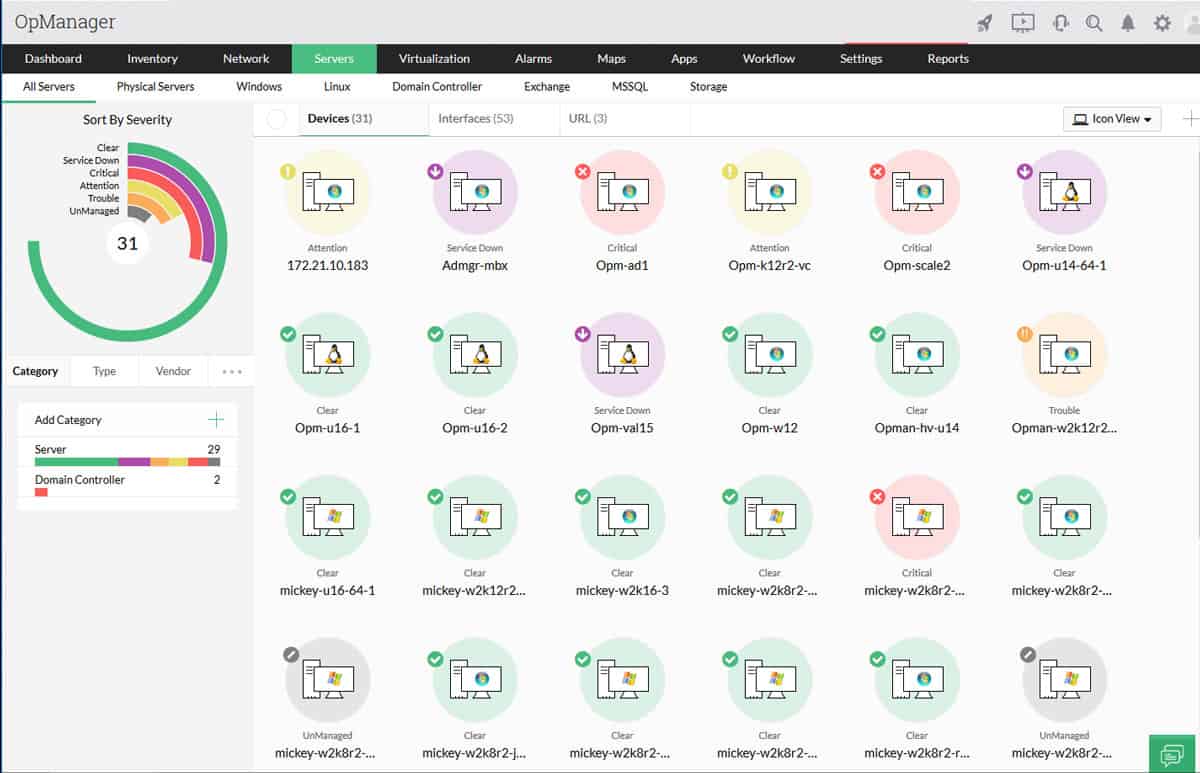
ManageEngine OpManager is a monitoring tool for servers, important applications, processes, and services. The tool uses WMI and SNMP protocols to constantly monitor the server’s availability.
Key Features:
- Automated Discovery and Network Mapping: Data is continuously updated
- Integrated Network Management: Works with SNMP
- Customizable Dashboards: Rearrange screens to suit your priorities
Why do we recommend it?
ManageEngine OpManager is an SNMP-based system and it will monitor servers and networks. The package focuses on hardware statuses, which include operating systems and firmware. SNMP polling discovers all devices and generates a hardware inventory. This includes endpoints running Windows, Windows Server, and Linux as well as network devices.
Out-of-the-box, OpManager can monitor around 300 performance metrics, such as processor queue length, memory, free physical memory, disk I/O, etc. You can check these metrics through recorded logs or with its graphical view in real-time. You can also be alerted of any event and create advanced reports.
Who is it recommended for?
This package is suitable for all sizes of businesses. There is a free edition available, however, this is limited to monitoring three devices. The smallest paid package is reasonably priced and monitors up to 25 devices. ManageEngine also provides an MSP version of the package. This system is delivered as software for Windows Server, Linux, AWS, or Azure.
Pros:
- Monitors Operating Systems: Windows and Linux
- Virtualization Monitoring: VMware, Hyper-V, and Citrix Xen
- Alerts can be Sent as Notifications: Set them up to channel through email, SMS, or Webhooks
Cons:
- No SaaS Package: However, the software can be installed on your own AWS or Azure account if you want to run it in the cloud
Start a 30-day free trial.
4. Nagios: Operating System Monitoring
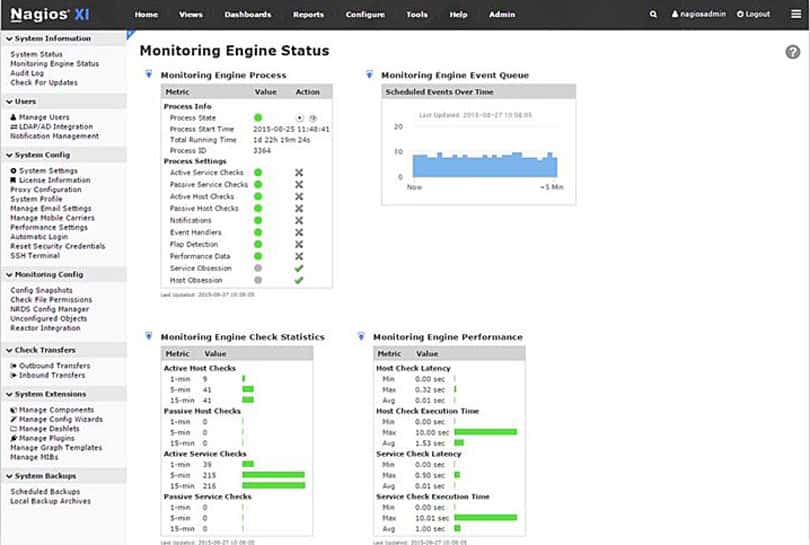
Nagios XI OS monitoring tool provides an extensive functionality for checking desktop and server OSs. Nagios works on Windows, Linux, Unix, OSx, Solaris, AIX, and HP-UX.
Key Features:
- Free and Paid Versions: The free tool is called Nagios Core; the paid version is called Nagios XI
- Full Stack Observability: Monitors networks, servers, and applications
- Expandable Service: A library of free plug-ins, called Nagios Exchange
Why do we recommend it?
Nagios is a well-established and stable system monitoring package. The tool is able to monitor network devices and endpoints and it will watch the performance of the applications that run over them. The package will monitor all operating systems and also virtual systems, such as Hyper-V and VMware hypervisors.
It can monitor your system’s performance counters, services and process states, event logs, specific applications (such as IIS, MySQL, etc), and services. When an event is undergoing, Nagios uses its proactive alarming system to alert managers.
Who is it recommended for?
Nagios is designed for use by system administrators working for mid-sized and large organizations. This package is only available for on-premises installation and it is only available for Windows. However, the software can be run on top of VMware and Hyper-V virtualizations and also Docker. Those options will enable the software to be run on Windows.
Pros:
- Open-Source Transparent Tool: Has been forked to create other monitoring packages
- Alerts: Can be forwarded by SMS and email
- Autodiscovery: Populates hardware and software inventories
Cons:
- Network Traffic Monitoring is a Separate Package: Not available for free
Nagios Core FREE and Nagios XI $1,995 with a 60 Day Trial offer!
5. Quest: Foglight for Operating Systems
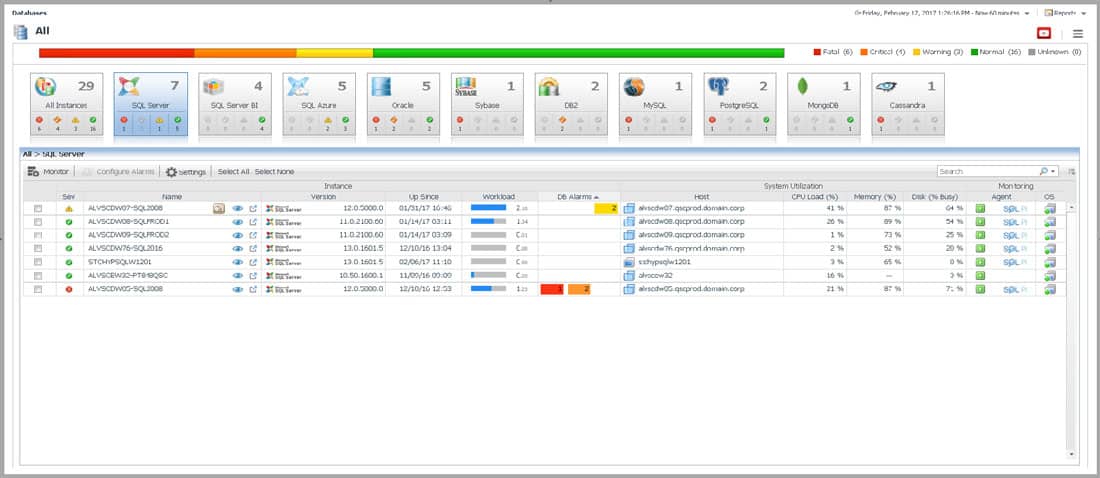
A tool used by midsize to enterprise businesses to monitor the performance across different operating systems. Foglight Evolve can monitor servers, databases, network devices, virtual systems, applications, etc.
Key Features:
- Designed for Data Centers: Supports cloud migration
- Tracks Applications and Servers: Includes virtual servers
- Automated Asset Discovery: Compiles inventories
Why do we recommend it?
Foglight Evolve is a monitoring package for large systems, tracking servers and applications. The service has evolved from tracking all types of servers to focus on the servers of data centers that host and deliver applications from the cloud. The service implements live monitoring and historical analysis.
With Foglight you can quickly find issues and analyze their root cause with the help of the real-time graphics of the OS processes.
The tool will collect some of the most important metrics such as storage capacity, I/O users, memory and CPU utilization, and create alarms and events if these metrics reach a certain threshold.
Who is it recommended for?
This package is suitable for large companies and Foglight, which usually caters to the mid-sized market, is particularly keen to sell this system to managed service providers. The stress on cloud system monitoring is the company’s attempt to shift to large data centers and server rental businesses.
Pros:
- Designed for Larger Businesses and Enterprise Networks: Particularly cloud data centers
- Collects All Key Server Metrics: Disk space, CPU, interfaces, and memory
- MSP Partnership Program: A sales drive to attract cloud service providers
Cons:
- No Price List: Must contact for pricing
Request Pricing on their Website.
6. EventSentry: System Health Monitoring
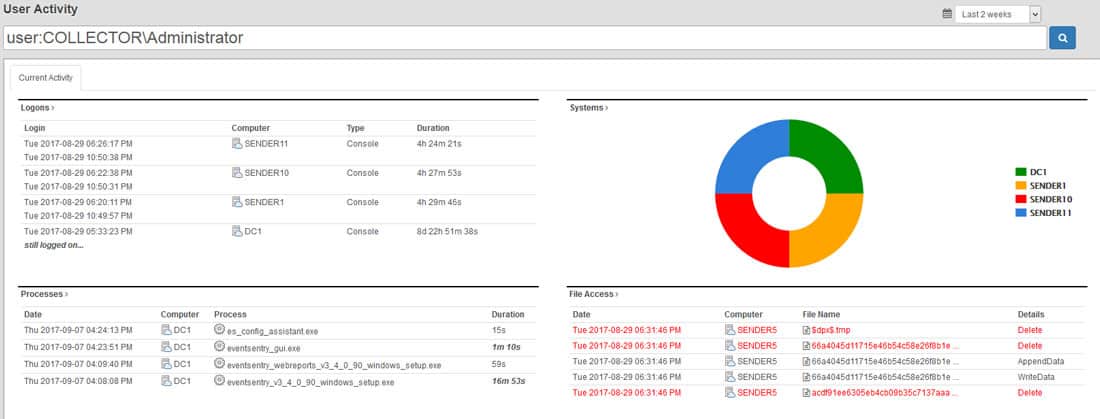
System Health Monitoring checks the most important aspects of different servers to make sure that they are healthy and running smooth. This tool can help a systems administrator know the health of a computer by analyzing different core components such as physical disk space, services, processes, scheduled tasks, applications, and hardware.
Key Features:
- Part of a System-Wide Security Monitoring Package: The EventSentry platform is a log-based SIEM
- Log Management: The foundation for all monitoring functions
- Performance Monitoring: A side benefit of the security monitoring task
Why do we recommend it?
EventSentry is a security monitoring package. However, its aim of scanning for activity anomalies also catches performance issues. Some performance problems could be caused by malicious activity so all aspects of server processes need to be investigated. This gives you a two-for-one deal. However, the same value could be achieved with any SIEM.
EventSentry’s System Health Monitoring collects data in real-time, analyzes it, and immediately raises alarms if necessary. The tool can also gather history information and predict trends on the system.
Who is it recommended for?
The typical buyer of EventSentry will be looking for a security scanner, not a performance monitor. However, our highlight of this dual purpose tool could hopefully alert buyers of security packages of the possibility of delivering performance and security monitoring with one tool.
Pros:
- Offers Live and Historical Insights: Uses an SNMP feed in addition to log gathering
- Web Interface: Although you host the package on Windows Server
- Features Built-In Compliance Management: For PCI DSS
Cons:
- More a Security Tool than a Performance Monitor: However, you could extract performance information from the activity searches
Starts at $98 per device and price goes down as your buy more licenses.
7. Zenoss: Server Monitoring
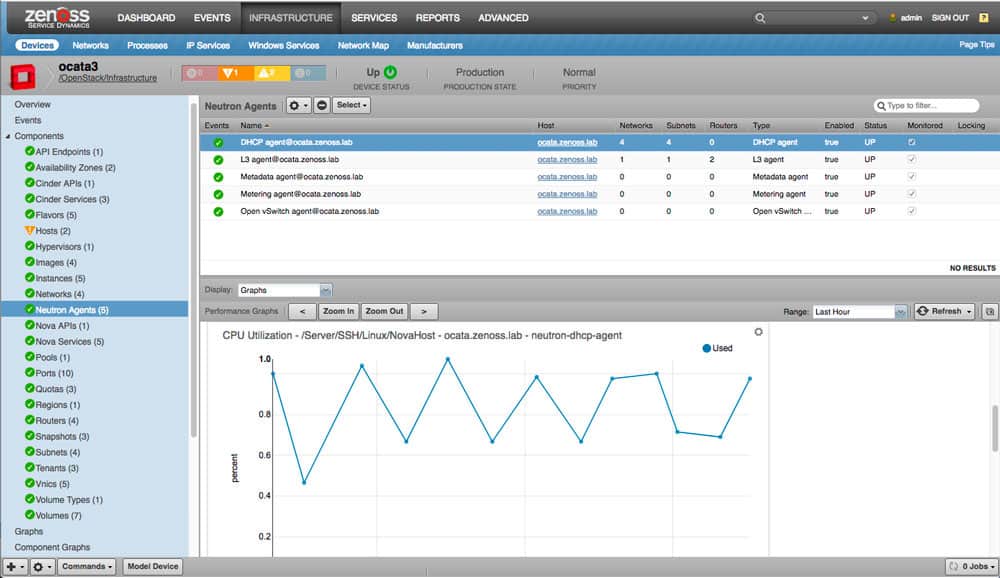
Server Monitoring from Zenoss checks and analyses the performance of servers in real-time. It can help systems administrators monitor a large selection of different OS vendors, such as Microsoft, Oracle, HP, Dell, Cisco, IBM, Linux, in a single dashboard.
Key Features:
- Designed for Linux Machines: Also available as a cloud-based SaaS package called Zenoss Cloud
- Expandable: A library of extensions, called ZenPacks
- Monitors Hybrid Systems: Scans on-premises and cloud servers
Why do we recommend it?
Zenoss has been around for nearly 20 years. The full stack observability package has always been a contender to the Nagios system. It originally had a free version, called Zenoss Core but that has now been deprecated. The package gives you network, server, and application monitoring along with operating system performance tracking.
Zenoss, Server Monitoring tool can gather information on core components like, physical disks, processors, memory cards, interface throughput, and monitor them periodically.
The tool will also auto-discover network elements as they come and go and keep them in a centralized networking inventory.
Who is it recommended for?
Whether you choose the on-premises or cloud versions of Zenoss, you get on-premises and cloud monitoring from the package. The cloud version closely models the functionality of the original Linux-based system. The tool will monitor AWS, Azure, and GCP platforms, and the Windows, Windows Server, and Linux operating systems along with virtualizations and applications.
Pros:
- On-Premises Version Runs on Linux: If you have Windows, run it over a VM
- System Discovery: Creates hardware and software inventories
- Uses AI for Capacity Requirement Predictions: For both immediate needs and long term capacity planning
Cons:
- The Free Version has Been Dropped: Zenoss Core is no more
8. Op5 Monitor
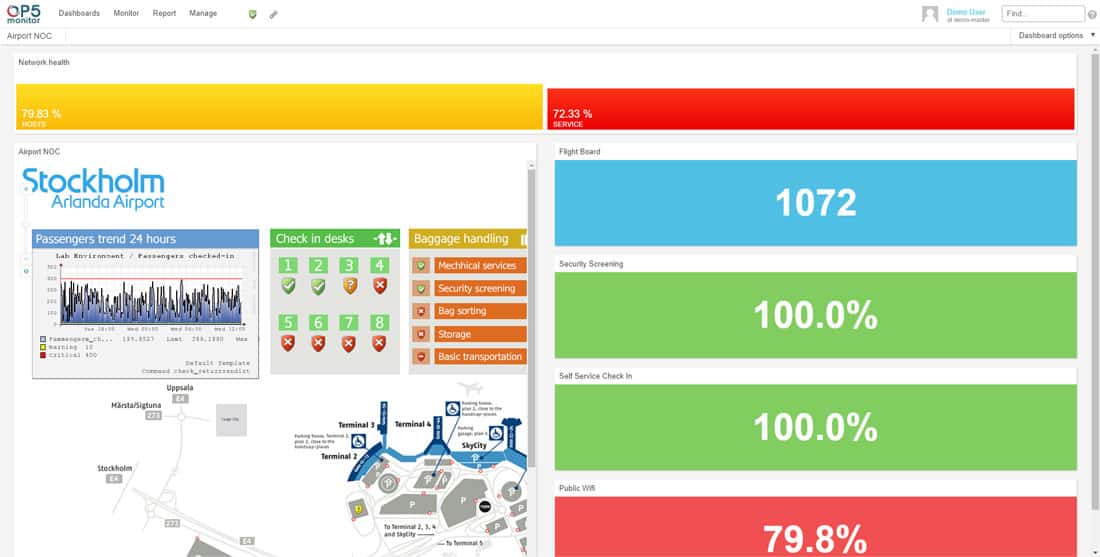
This product is based on the open-source project Nagios, and it’s developed by OP5. The OP5 Monitor is a monitoring tool designed to check servers, applications, networks, and storage (whether on-premise, hybrid, or in the cloud).
Key Features:
- Log Monitoring: Collects and stores log messages
- Performance Monitoring: Networks, servers, software, cloud platforms, and web applications
- Preconfigured Alert Templates: Can be forwarded as notifications by email
Why do we recommend it?
ITRS OP5 Monitor is a descendant of Nagios Core – it is a fork of Naemon, which was a fork of Nagios. The service inherited the Nagios architecture of a central package of essential services that can easily be supplemented by plug-ins to add-on monitoring for technologies that not all customers will have.
It can show the performance and health of the entire network in its interactive dashboard, and log all events with the OP5 Logger. With OP5 Monitor you can also gain full control of distributed IT environments in a single place.
Among its most useful features are reporting and alerting, SNMP traps, log server monitoring, management packs, and automatic self-healing.
Who is it recommended for?
The package is designed to run on Linux but it is also available as a SaaS platform in the cloud, which is an option for businesses that only have Windows on site. ITRS also offers a managed service, which provides a team of technicians to watch over the monitoring system as well as host it.
Pros:
- Deployment Options: On-premises or SaaS
- System Discovery: Automatically populates system inventories
- Application Dependency Mapping: Provides fast root cause analysis
Cons:
- No Price List: You have to contact sales for a quote
Request Pricing online.
Conclusion
Operating Systems are not vulnerable to failures, but getting 1 step ahead of them doing so on your Watch is a step in the right direction.
Malfunctioning processes and OS services could increase the load on the CPU, which in turn could put the fans to work hard, which in turn could increase the temperature of the processor… it is an endless cycle.
The Best OS Monitoring Tools will not solve the problem… but it will help you pinpoint the issue before a real catastrophe occurs and maintain your systems healthy.
OS Monitoring Software and Tools for Managing Windows/Linux OS FAQs
What is operating system monitoring?
Operating system monitoring is the process of monitoring the performance and health of computer operating systems in real-time. This includes monitoring key performance indicators (KPIs) such as CPU utilization, memory usage, disk space utilization, and more.
Why is operating system monitoring important?
Operating system monitoring is important because it helps identify performance issues and potential problems before they become critical. This helps prevent downtime, improves the stability and reliability of your systems, and ensures that your applications and services are running optimally.
What KPIs are typically monitored in operating system monitoring?
Common KPIs that are monitored in operating system monitoring include CPU utilization, memory usage, disk space utilization, network traffic, and process utilization.
What tools are used for operating system monitoring?
There are a variety of tools available for operating system monitoring, including SolarWinds Network Performance Monitor (NPM), Atera, Paessler PRTG, ManageEngine OpManager, Nagios XI, and more.
Can operating system monitoring be done remotely?
Yes, many operating system monitoring tools provide the ability to monitor systems remotely, allowing you to monitor your systems from a central location, no matter where they are located.
Can operating system monitoring be customized?
Yes, many operating system monitoring tools allow you to customize monitoring, including setting custom thresholds and alerts, creating custom dashboards, and more. This allows you to focus on the metrics that are most important to you.
How does operating system monitoring help prevent downtime?
Operating system monitoring helps prevent downtime by identifying performance issues and potential problems before they become critical. This allows you to take proactive steps to resolve issues and prevent downtime, improving the stability and reliability of your systems.