We may earn a commission if you make a purchase through the links on our website.
The Best Python Debugging Tools
UPDATED: January 3, 2024
These tools expand your Python debugging capabilities beyond what the standard print() function can achieve.
The debugging phase can get frustrating quickly with no means of diagnosing and fixing your code problems. Python includes some basic functions that can assist debugging (see below for the print() process). Still, you might need assistance from third-party tools to expand your debugging abilities.
This article discusses nine different tools that you can use to debug Python, meaning both diagnosing and mitigating bugs. The tools vary in their function, but they can be broadly categorized into two roles, IDEs and Bug Reporting Tools.
See below for some more insights into how these two types of tools can improve your debugging.
Here is our list of the best Python debugging tools:
- Site24x7 – EDITOR'S CHOICE Offers real-time performance insights, seamless integration with Python environments, and a comprehensive alerting system making it invaluable for developers seeking to optimize application health and user experience. Site24x7's ease of use and robust feature set solidify its position as an essential tool for maintaining high-performance Python applications. Start a 30-day free trial.
- Sentry A comprehensive bug tracking and performance monitoring tool with great tools for getting granular feedback on bug reports with actionable insights that link directly to your development environment.
- Pycharm A Python-specific IDE with excellent debugging facilities makes it one of the best Python debugging tools for the core development process.
- Rollbar Another bug reporting and error aggregation solution. Rollbar provides lots of notification control tools and tracking tools to improve your debugging workflow.
- Instabug A bug reporting solution focused mainly on mobile user testing and feedback aggregation, with VCS integrations available.
- Visual Studio Microsoft presents one of the best IDEs for debugging on the market, with many bug diagnosis features available in a professional product.
- Raygun Built for crash reporting and bug monitoring, this solution has a suite of mitigation tools for integrated bug diagnosis and fixing.
- Glitchtip An open-source option for bug reporting. Glitchtip provides all of the primary functions of premium products while remaining free and highly flexible.
- Komodo IDE An open-source IDE that can support several languages (including Python) with excellent debugging tools and VCS integration.
- Icecream An alternative to print() that expands on the delivered information that improves the debugging capabilities of the standard go-to function.
Print()
If you’re looking for tools to help you debug Python, you’re likely already familiar with the print() function. If not, this function can be beneficial to assist in your debugging since it will output a defined parameter. While many of the solutions on this list introduce third-party debugging methods, you can always rely on the print() function to find bugs during development.
Another solution on this list, Icecream, can enhance the print() function to make it even more useful. It does this by introducing more details exposed by the print() output, increasing your debugging capabilities.
IDEs
One of the best ways to improve your debugging capabilities is by upgrading your IDE. This is because your development environment has a subtle but large impact on your coding abilities. While most premium IDEs function the same way, we’ve included a few on this list targeted explicitly towards better debugging.
Bug Reporting Tools
Debugging during the development stages is important, but most of your bugs will be caught during the testing and post-deployment phases. In addition, your QA team, external testers, and end-users will undoubtedly discover bugs during their hands-on time with your product.
To aid in this, bug reporting and aggregation tools exist to provide a platform for faults to be logged and your bug handling developers to be notified. These tools integrate directly with your development environment or workflow systems to smooth out the debugging process. We’ve included a number of these tools on our list for you to check out.
The Best Python debugging tools
Our methodology for selecting Python debugging tools
We reviewed the market for Python debugging systems and analyzed options based on the following criteria:
- Code checker that is built into program editors for Python scripts
- Static code scanner
- Integration with bug trackers
- Automated testing options that will integrate into a CI/CD pipeline
- Explanation for each detected error
- Free trial for a no-obligation assessment opportunity or a free tool
- Value for money from a debugging tool that can be used for a range of programming languages, not just Python
With these selection criteria in mind, we identified a number of Python debugging tools with both free and paid options in our list.
1. Site24x7 Python Monitoring – FREE TRIAL
While Site24x7 is primarily known for its monitoring capabilities, it also offers valuable features that can be leveraged for debugging Python applications, especially in a production environment. Its ability to monitor application performance and log data in real time makes it a useful tool for identifying and troubleshooting issues in Python-based applications.
Key Features:
- Real-time application performance monitoring for Python
- Logging and error-tracking capabilities
- Customizable alerts based on application metrics
- Detailed reports and analytics
- Improved user experience monitoring for Python applications
Why do we recommend it?
Site24x7 is recommended for Python debugging due to its comprehensive monitoring and logging features. These capabilities are essential for identifying and resolving issues in Python applications, particularly in live environments where traditional debugging tools may not be feasible.
Who is it recommended for?
This tool is particularly suited for developers and operations teams who manage Python applications in production environments. It’s also valuable for those who need to ensure the optimal performance and reliability of their Python applications.
Pros:
- Efficient performance monitoring for Python applications
- Useful logging and error-tracking features
- Customizable alerting for proactive issue resolution
Cons:
- May not provide the in-depth code-level debugging features that some Python developers require
EDITOR'S CHOICE
Site24x7's capabilities in monitoring Python applications make it our top choice for debugging tools, particularly in production environments. Its strength lies in its ability to provide real-time performance insights and error tracking, which are invaluable for maintaining the health of Python applications. What sets Site24x7 apart is its seamless integration with Python environments, allowing developers to not only monitor but also effectively troubleshoot and optimize their applications. The tool's comprehensive alerting system and detailed analytics enable quick identification and resolution of issues, ensuring minimal downtime and enhanced user experience. The ease of use, combined with its robust feature set, makes Site24x7 an essential tool for Python developers looking to maintain high-performance and reliable applications.
Download: Get a 30-day free trial
Official Site: https://www.site24x7.com/python-monitoring.html
OS: Cloud-based
2. Sentry
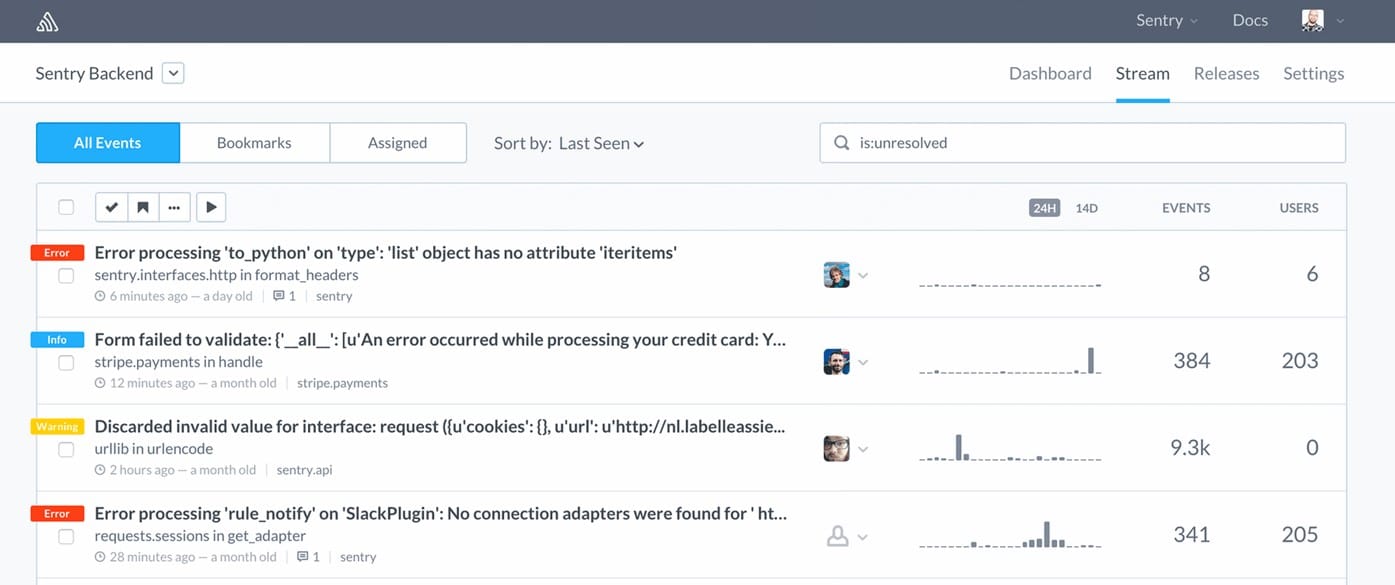
Sentry is an error-tracking and performance-monitoring solution that can diagnose and fix Python issues. A stack trace feature replicates your development environment and allows you to break down detected errors and get more significant insights into where the code produces bugs.
Key Features:
- Error Detection: Automatically detects errors in Python code, providing detailed insights into the root causes of issues.
- Performance Monitoring: Monitors the performance of Python applications, allowing developers to identify and address performance bottlenecks.
- Stack Tracing for Error Insights: Replicates the development environment and provides stack traces for detected errors, facilitating rapid diagnosis and resolution.
- Event Log Reader: Aggregates errors into a filterable list and provides an event log reader for tracking error occurrences.
- Free with Limited Capacity: Offers a free version with limited user capacity, making it accessible to individual developers and small teams.
Why do we recommend it?
Sentry is highly recommended for its robust error-tracking and performance-monitoring capabilities, particularly for Python-based projects. With its advanced stack tracing feature, Sentry allows developers to diagnose and fix Python issues efficiently by replicating the development environment and providing detailed insights into detected errors. This enables developers to identify and address bugs quickly, leading to improved code quality and overall project stability. It offers a comprehensive suite of features, including error detection, performance monitoring, stack tracing for error insights, and event log reading, empowering developers to streamline their debugging processes and enhance productivity.
The service aggregates your errors into a filterable list and can allow you to label sections of your code with tags to help you quickly replicate errors. The performance monitoring tools also expand your diagnosis abilities, allowing you to see anomalous readouts found within your development projects easily.
Who is it recommended for?
Sentry is ideal for developers and teams working on Python-based projects who require comprehensive error tracking and performance monitoring. It caters to individuals and organizations seeking a reliable solution for diagnosing and resolving errors in their codebase. Additionally, Sentry is well-suited for developers who prioritize open-source solutions and require support for multiple programming languages beyond Python, such as Go, JavaScript, and Ruby. Its versatility and scalability make it suitable for individual developers, small teams, and larger organizations looking to streamline their development workflows and improve code reliability.
Pros:
- Completely Open Source: Open-source solution, providing transparency and flexibility for developers.
- Multidimensional Data Querying: Supports querying multidimensional data structures, allowing developers to analyze error data from various perspectives.
- Root Cause Analysis: Facilitates root cause analysis for faster resolution times, enabling developers to address underlying issues effectively.
- Wide Range of Integrations: Supports integration with various logging and PSA tools, enhancing its versatility and interoperability.
Cons:
- Not Ideal for Enterprise Organizations: While suitable for individual developers and small teams, Sentry may not offer the scalability and enterprise-level features required by larger organizations.
Sentry is entirely free to use the basic features with limited user capacity. For premium options, you can upgrade to the Team package for $26/month which improves the error detection systems, or the Business package for $80/month which expands on the error insights even further.
Both the Team and Business versions have a free trial available. There are also Enterprise-scale options if you contact Sentry directly if you need large-scale considerations that provide complete platform error monitoring and cross-project insights.
Sentry is great for a Python debugging tool because it provides code scans that detect a range of errors. The tool produces a list of detected errors with explanations of why that particular code is considered a problem and how to fix it. As well as monitoring Python, the Sentry package is able to scan code written in Go, Javascript, and Ruby, among other languages. The service will check on programs written for mobile devices and Web applications as well as APIs.
3. Pycharm
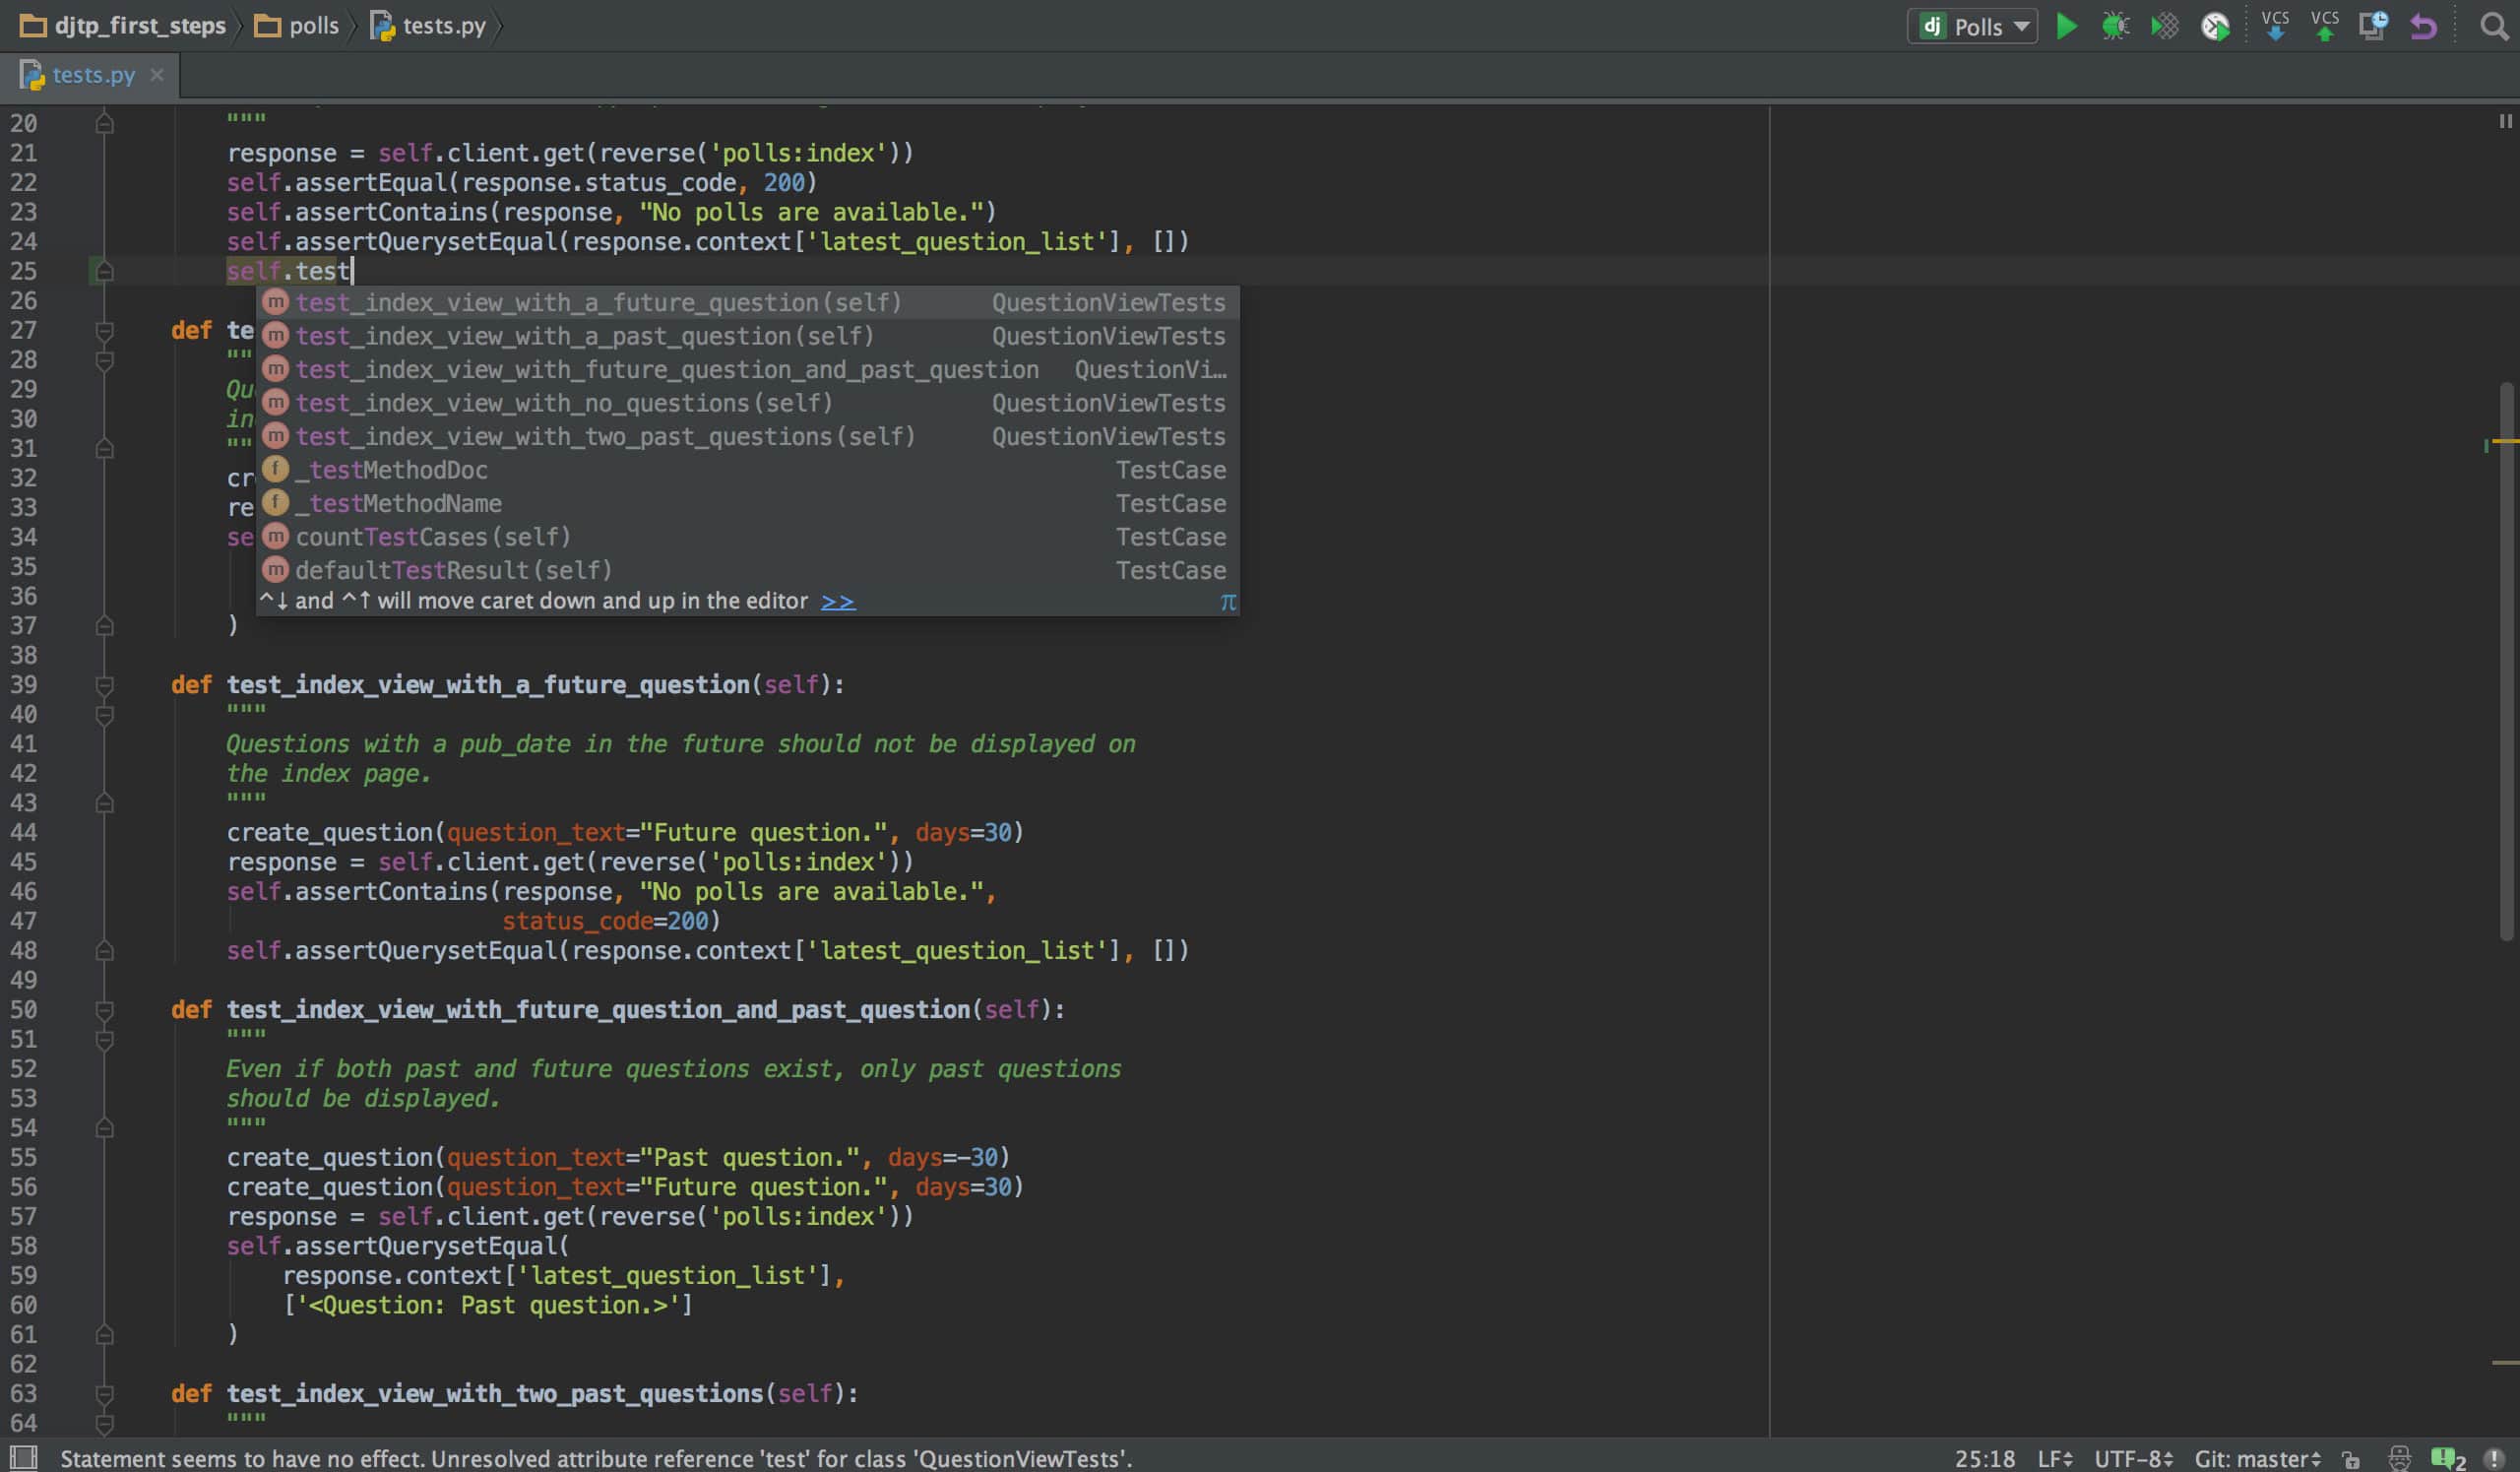
Pycharm is a python-focused IDE with some of the best python debugging tools available within an IDE. Furthermore, the intelligent assistance features provide smart auto-completion and error checking, which massively reduces bugs. In addition to the debugging tools, the solution offers a variety of tools that are useful for overall development.
Key Features:
- Python IDE: Provides a dedicated environment tailored specifically for Python development, offering a comprehensive set of tools and features.
- Smart Assistance Features: With intelligent auto-completion and error checking, Pycharm helps developers write code more efficiently and accurately.
- Web Development Frameworks: Beyond Python, Pycharm supports various web development frameworks, allowing developers to work on full-stack projects seamlessly.
- VCS Integration: Seamlessly integrates with version control systems, facilitating collaboration and code management within teams.
- Graphical Debugger: The graphical debugger in Pycharm provides a visual interface for debugging Python code, aiding developers in identifying and resolving issues effectively.
Why do we recommend it?
Pycharm stands out as an exceptional Python-focused IDE, offering unparalleled debugging tools within its environment. Our testing has shown that these tools significantly enhance the debugging process, leading to a reduction in bugs and smoother development cycles. With intelligent assistance features providing smart auto-completion and error checking, Pycharm ensures efficient and error-free coding experiences. Our recommendation is based on firsthand experience with the product, where its capabilities have proven indispensable in our development workflows.
The product is built on open-source foundations, meaning it has massive support and general flexibility. Premium offerings also support JavaScript, HTML/CSS, SQL, in addition to Python, drastically increasing the usability of the tool in a broader range of projects.
Who is it recommended for?
Pycharm is highly recommended for Python developers seeking a comprehensive integrated development environment. Its robust debugging tools and smart assistance features make it ideal for developers working on complex Python projects. Additionally, its support for web development frameworks and VCS integration extends its suitability to web developers and teams collaborating on version-controlled projects. Whether you're a seasoned Python developer or just starting, Pycharm offers the tools and support needed to streamline your development process.
Pros:
- Python-Focused Debugging Tools: Excels in providing advanced debugging tools tailored specifically for Python development.
- Smart Auto-Completion: Intelligent assistance features offer smart auto-completion, enhancing coding productivity and accuracy.
- Built on an Open-Source Platform: Being built on open-source foundations, Pycharm enjoys massive support and flexibility for customization.
- Highly Flexible and Supports Other Languages: Flexibility extends beyond Python, with premium offerings supporting additional languages like JavaScript, HTML/CSS, and SQL, making it versatile for diverse project requirements.
Cons:
- Lacks AI Capabilities: While Pycharm offers robust features, it currently lacks advanced artificial intelligence capabilities, which may be a limitation for developers seeking AI-driven tools.
Pycharm comes in two versions, a completely free Community version and a premium Professional version that adds additional features. The Professional version adds enhanced support for both scientific and web python development and has a free trial available to download.
4. Rollbar
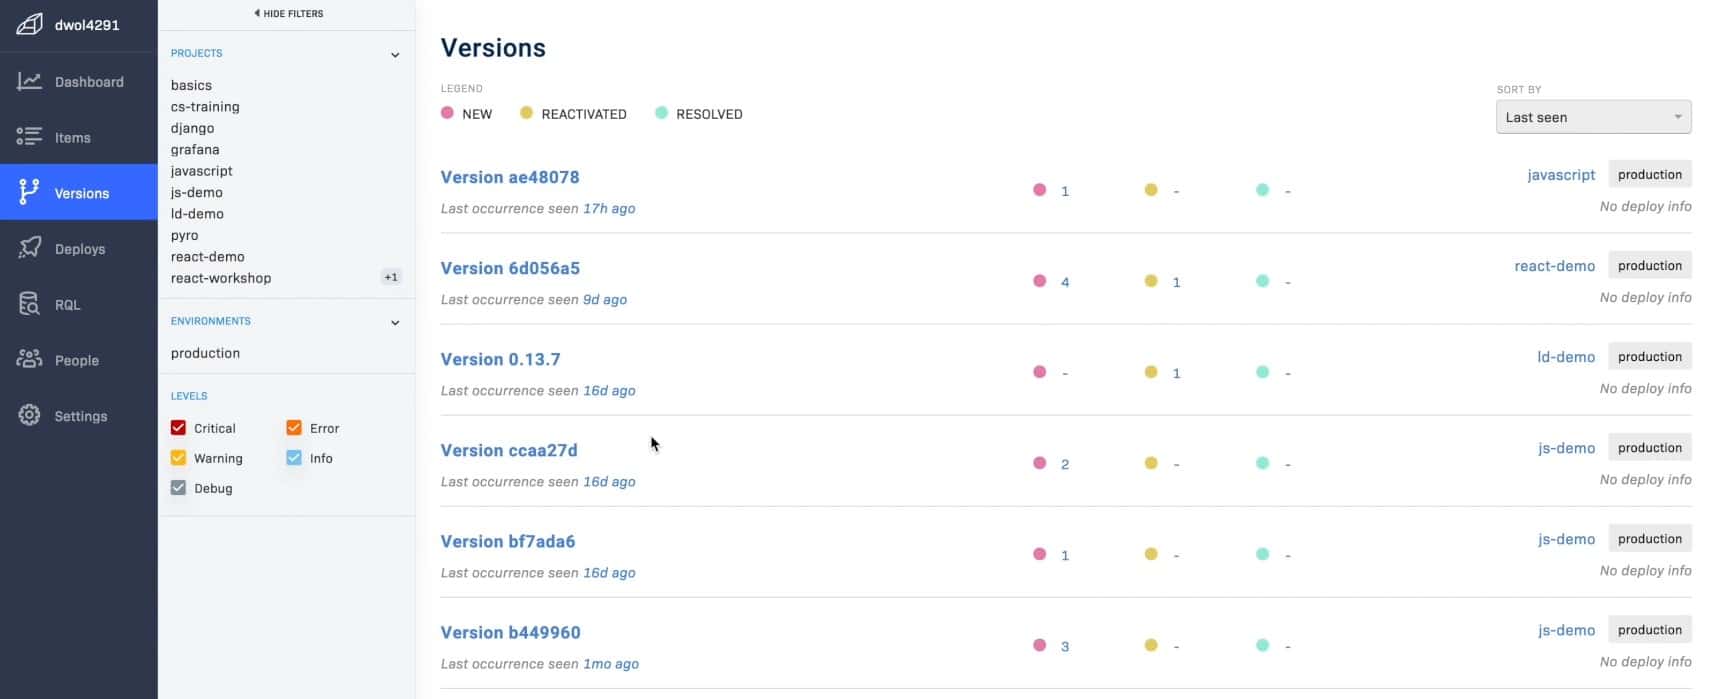
Rollbar is another error reporting and fault aggregation tool built around real-time bug discovery features. The solution features a suite of notifications for fast and accurate bug reporting, but it also intelligently groups bug notifications for better readability.
Key Features:
- Bug Reporting and Aggregation: Aggregates and reports errors in real-time, providing teams with comprehensive insights into their application's performance and stability.
- Real-Time Bug Notifications: With real-time notifications, Rollbar ensures that developers are promptly alerted to any issues occurring within their applications.
- Error Management: Offers robust error management capabilities, enabling teams to effectively track, prioritize, and resolve issues.
- Workflow Integration: Seamlessly integrates with various workflows and development tools, ensuring smooth incorporation into existing processes.
- Free with Limited Capacity: Offers a free tier with limited capacity, allowing users to experience its features and benefits before committing to a paid plan.
Why do we recommend it?
Rollbar is a highly recommended error reporting and fault aggregation tool that excels in real-time bug discovery and analysis. Our own testing has demonstrated its effectiveness in swiftly identifying and reporting bugs as they occur, enabling teams to address issues promptly and maintain the stability of their projects. With its suite of notifications and intelligent grouping features, Rollbar ensures that bug reports are delivered quickly and comprehensively, enhancing overall development efficiency.
Automated issue tracking and workflow triggers allow you to prevent your projects from shipping with known but unaddressed bugs inadvertently. In addition, telemetry data pulled through the various integrations available means you can also track where bugs appear to speed up remediation.
Who is it recommended for?
Rollbar is recommended for teams and developers seeking a robust error management solution with real-time bug detection capabilities. Its seamless integration with various workflows makes it suitable for projects of all sizes and complexities. Additionally, the free tier offering, with support for up to 25,000 error events, makes it an attractive option for startups and small businesses looking to enhance their error monitoring capabilities without significant financial investment.
Pros:
- Supports Real-Time Bug Discovery and Analysis: Excels in detecting and analyzing bugs as they occur, facilitating rapid issue resolution.
- Supports Various Integrations for Practically Any Workflow: With its extensive integration options, Rollbar seamlessly integrates into diverse development environments, enhancing workflow efficiency.
- Free for up to 25,000 Error Events: The free tier offering provides substantial value for startups and small businesses, enabling them to benefit from Rollbar's features without financial barriers.
Cons:
- Better Suited for Larger Environments: While Rollbar is versatile and scalable, it may be better suited for larger environments with higher error event volumes, potentially presenting limitations for smaller teams or projects.
Rollbar is free for up to 25,000 error events with enough essential features to get you off the ground, especially in a small development team. Premium plans include the Essentials plan for $21 per month for up to 50,000 error events. The Advanced plan expands up to 100k error events and enables a multi-project feed perfect for a CI/CD workflow.
5. Instabug
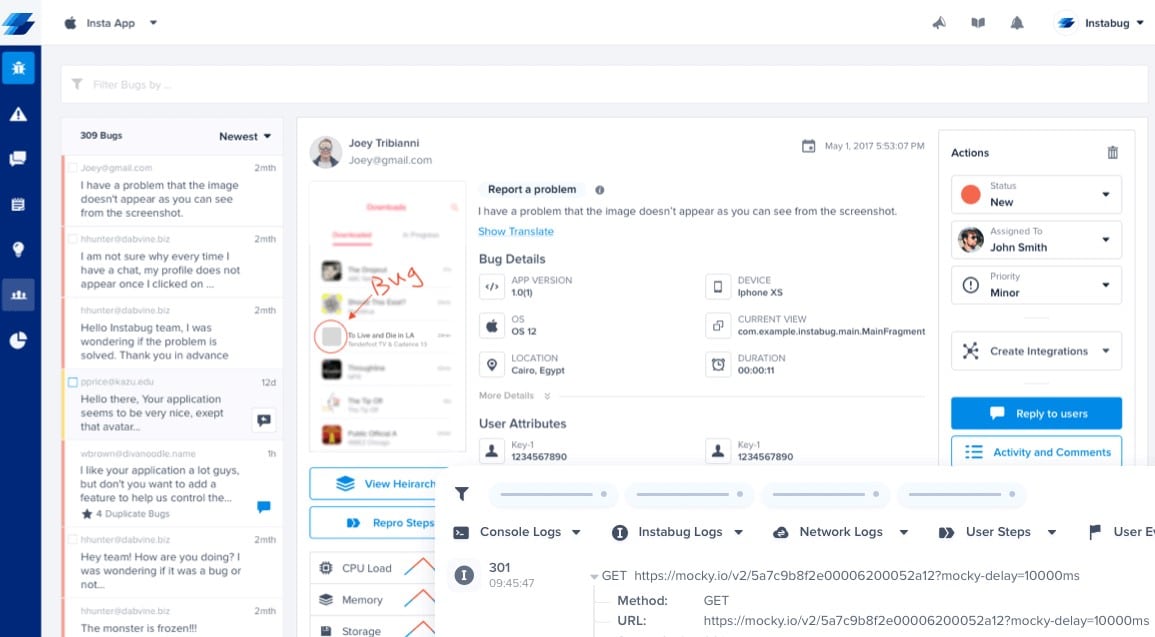
Instabug is a bug-reporting tool built primarily for mobile testing. The system relies on human testers identifying bugs within a given product, but it provides a solution to aggregate and manage bug-related feedback. The product isn’t built specifically for Python, or any language in particular, since it simply works as a feedback device.
Key Features:
- Mobile Bug Reporting: Provides a robust platform for reporting and managing bugs in mobile applications, ensuring comprehensive bug tracking and resolution.
- Log Data: Bug reports can be compared with log data, providing developers with valuable insights into reported issues and facilitating faster debugging.
- Performance Monitoring: Offers performance monitoring capabilities, allowing developers to track app performance metrics and identify areas for optimization.
- Large Number of Integrations: With extensive integrations including Github, Slack, and Trello, Instabug seamlessly integrates into various development workflows, enhancing collaboration and productivity.
- Automatic Notifications: Automatically notifies developers of new bug reports and performance issues, enabling prompt action and resolution.
Why do we recommend it?
Instabug earns our recommendation due to its comprehensive bug-reporting solution tailored specifically for mobile testing environments. With its emphasis on human testers' feedback aggregation and management, Instabug facilitates seamless communication between testers and developers, leading to faster bug resolution and improved product quality. Our extensive experience with Instabug has demonstrated its effectiveness in streamlining the bug-fixing process, ultimately enhancing the overall development workflow. Additionally, Instabug's user-friendly interface and versatile communication options contribute to its appeal, making it a valuable asset for mobile app development teams striving for efficiency and collaboration. In summary, Instabug's focus on mobile bug reporting, coupled with its robust features and intuitive interface, positions it as a top choice for developers seeking an effective bug-tracking solution.
Bug reports can be compared with log data for better insights into reported problems. In addition, the solution has a substantial base of integrations, including Github, Slack, and Trello, to smooth the development workflow.
Who is it recommended for?
Instabug is an ideal choice for mobile app developers and testing teams seeking an efficient bug-reporting tool with a user-friendly interface. Whether you're a solo developer or part of a large team, Instabug's versatile communication options and seamless integrations cater to diverse workflows and project requirements. While its primary focus is on mobile testing, Instabug's features and capabilities make it suitable for developers working on iOS and Android applications across various industries. Furthermore, Instabug's automatic notifications and performance monitoring enhance the productivity of development teams, making it a valuable asset for anyone striving for excellence in mobile app quality assurance and bug management.
Pros:
- Excellent User Interface: Boasts a user-friendly interface that simplifies the bug-reporting process for both testers and developers, enhancing collaboration and efficiency.
- Variety of Communication Options: Offers multiple communication channels for teams, facilitating seamless collaboration and workflow integration.
- Automatic Notifications and Performance Monitoring: Provides automatic notifications for new bug reports and performance issues, ensuring timely attention and proactive monitoring of app performance.
Cons:
- Designed Primarily for Mobile Testing: While Instabug excels in mobile bug reporting, its primary focus on mobile testing may limit its applicability for developers working on other platforms or types of applications.
- Needs a Longer Trial: Some users may prefer a longer trial period to fully evaluate Instabug's features and suitability for their projects before committing to a paid plan.
Instabug has a 14-day free trial available. The Basic product package is built for small businesses and costs $149 per month. The Pro product adds additional diagnosis features and more integration options and costs $249 per month. The Premium solution is for Enterprise-scale businesses and massively expands on diagnosis options, including an on-premises hosting option. Still, you need to contact the company directly for a personalized quote on pricing.
6. Visual Studio
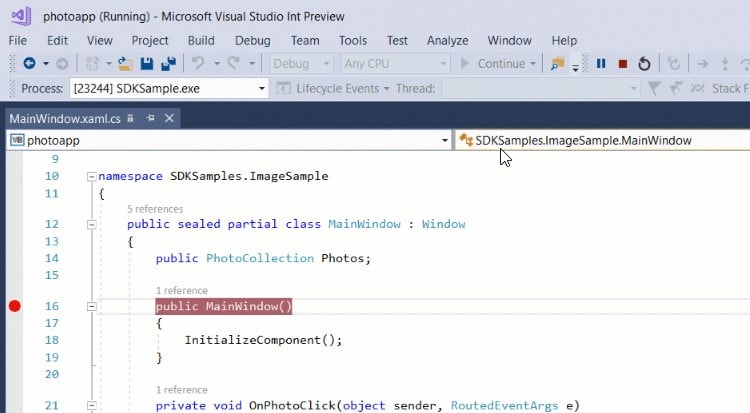
Microsoft Visual Studio is an IDE with one of the most advanced debugging toolsets of any IDE on the market today. For example, you can use the breakpoint to pick out specific lines of code that may be causing issues, and use the inbuilt visual debugging tools to diagnose problems and mitigate faults.
Key Features:
- Professional IDE: Offers a professional-grade integrated development environment equipped with a comprehensive set of tools and features.
- Expanded Debugging Features: With advanced debugging capabilities, including breakpoints and visual debugging tools, Visual Studio empowers developers to identify and resolve issues efficiently.
- Visual Debugger: Built-in visual debugger in Visual Studio provides a user-friendly interface for debugging code, enhancing developers' ability to diagnose and fix faults effectively.
- Lots of Available Integrations: Supports numerous integrations with third-party tools and services, allowing developers to customize their development environment and streamline workflows.
- Multi-Language (Including Python): Supports a wide range of programming languages, including Python, making it suitable for diverse development projects and environments.
Why do we recommend it?
Microsoft Visual Studio earns our recommendation for its status as an industry-leading IDE equipped with one of the most advanced debugging toolsets available. The suite of debugging features, including breakpoints and visual debugging tools, empowers developers to efficiently identify and resolve issues within their codebase. Our own experience with Visual Studio has highlighted its effectiveness in streamlining the debugging process, ultimately enhancing development productivity and code quality. With its multi-language support and seamless integration capabilities, Visual Studio stands out as a versatile and indispensable tool for developers across various industries and project requirements. In summary, Visual Studio's robust debugging capabilities, coupled with its user-friendly interface and extensive feature set, position it as a top choice for developers seeking a comprehensive IDE for their development projects.
You can also activate the debugging tool in step sequences to identify precisely what line of code is causing problems. Effectively, the suite of debugging features within Visual Studio means it can rival any other IDE to fix faults. Moreover, the usability extends to Python since Visual Studio can support a massive range of languages.
Who is it recommended for?
Visual Studio is recommended for developers and development teams seeking a professional IDE with advanced debugging features and multi-language support. Whether you're a beginner or an experienced developer, Visual Studio's intuitive interface and expansive feature set cater to diverse skill levels and project complexities. While it excels in supporting languages like Python, its compatibility with a wide range of languages makes it suitable for developers working on various platforms and technologies. Additionally, Visual Studio's popularity and widespread adoption in the industry ensure ample community support and resources for developers seeking assistance or collaboration. Overall, Visual Studio is an ideal choice for anyone looking to boost their development efficiency and code quality within a comprehensive and feature-rich IDE environment.
Pros:
- Supports Python and Other Languages: Multi-language support enables developers to work on projects in various programming languages, including Python, enhancing flexibility and versatility.
- One of the Most Popular IDEs on the Market: Widespread adoption and popularity among developers ensure ample community support and resources, contributing to a vibrant and thriving developer ecosystem.
- Features a Visual Debugger: Provides developers with an intuitive interface for debugging code, simplifying the process of identifying and resolving issues effectively.
Cons:
- Not Ideal for Those Looking to Leave Visual Studio for Alternatives: While Visual Studio offers a robust set of features and capabilities, some developers may find it challenging to transition to alternative IDEs due to its extensive feature set and integration ecosystem.
Visual Studio comes in various formats, including a free, open-source version designed for individual small-scale developers called the Community version. If you’re working as part of a team, you may want to look into the Business option, which can be acquired as part of a subscription for $45 per month. Enterprise options also exist for large-scale business demands, for $250 per month.
7. Raygun
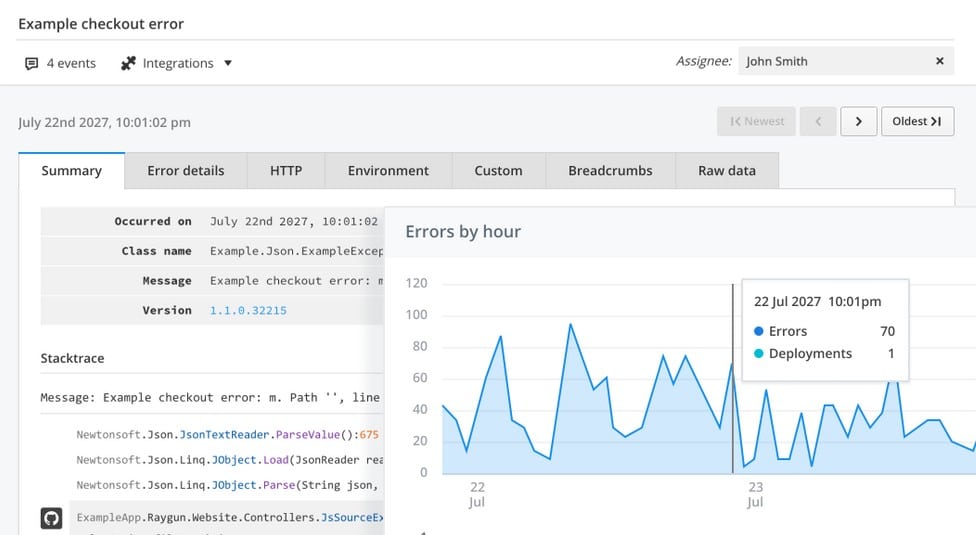
Raygun provides accurate crash reporting and bug feedback by aggregating user data. In addition, the solution provides the tools for bug tracking and mitigation solutions for debugging. Those functions on top of the user data monitoring mean this solution is best for debugging an already-live service.
Key Features:
- Bug Feedback: Provides comprehensive bug feedback solutions, enabling developers to gather valuable insights from user-reported issues.
- Crash Reporting: With robust crash reporting capabilities, Raygun helps developers identify and prioritize critical issues impacting application stability.
- Diagnostics and Mitigation Tools: Offers diagnostics and mitigation tools to streamline the debugging process and facilitate faster issue resolution.
- User Monitoring Platform: User monitoring platform enables real-time monitoring of user interactions and application performance, facilitating proactive issue detection and resolution.
- Modular Pricing Model: Offers a modular pricing model, allowing users to choose and pay for the services they require, ensuring cost-effectiveness and flexibility.
Why do we recommend it?
Raygun earns our recommendation for its comprehensive suite of crash reporting and bug feedback solutions, coupled with robust diagnostics and mitigation tools. By aggregating user data and providing actionable insights, Raygun facilitates efficient debugging of live services, allowing developers to identify and resolve issues promptly. Our experience with Raygun has highlighted its effectiveness in streamlining the debugging process and improving overall software quality. With its modular pricing model, Raygun offers flexibility for users to choose the services they require without paying for unnecessary extras, making it a cost-effective solution for teams of all sizes.
However, the solution divides its main functions between three different products. This means you can opt into the services you require without paying for extras, but it does also mean that if you need a fully-featured solution, you may end up paying more than other available options.
Who is it recommended for?
Raygun is recommended for developers and teams seeking an effective solution for debugging live services and monitoring user data. Its focus on crash reporting, bug feedback, and user monitoring makes it particularly suitable for scenarios where real-time insights into application performance are crucial. Whether you're a startup or an enterprise, Raygun's modular pricing model allows you to tailor the solution to your specific needs, ensuring optimal value for your investment. While its main functions are divided between three different products, this approach offers flexibility and scalability, enabling users to scale their usage as their needs evolve. In summary, Raygun is an ideal choice for organizations looking to enhance their debugging and monitoring capabilities in a cost-efficient and scalable manner.
Pros:
- Simple Visual Debugger: Features a user-friendly visual debugger that simplifies the debugging process, enhancing developer productivity and efficiency.
- Offers Crash Reporting and Bug Feedback: Provides comprehensive solutions for crash reporting and bug feedback, enabling developers to identify and resolve issues promptly.
- Supports User Monitoring: User monitoring capabilities enable real-time monitoring of user interactions and application performance, providing valuable insights for improving user experience and application stability.
Cons:
- Better Suited for Real User Monitoring Use Cases: While Raygun offers comprehensive debugging and monitoring solutions, its focus on real user monitoring may make it less suitable for scenarios where simulated testing environments are preferred.
The solution is separated into three primary services, each accessible for a free trial on the website. The Application Performance Monitoring and Real User Monitoring solutions, which start at $8 per month, will benefit your monitoring needs. The Error Monitoring & Crash Reporting program, which starts at $4 per month, is where you'll find the correct Javascript debugging tools. Similarly, each product's pricing is scalable based on the needed capacity, with 10,000-unit increments being the norm.
8. GlitchTip
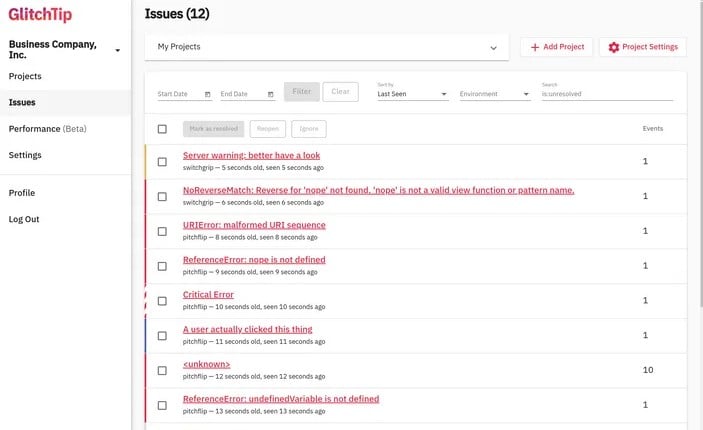
GlitchTip is an open-source error reporting tool that collects and manages bug reports and displays them in a readable, fixable solution. It excels above other solutions because it is open source, meaning there’s a more substantial body of support compared to some other products.
Key Features:
- Open Source: Open-source error reporting tool, providing transparency, flexibility, and robust community support.
- Error Reporting and Aggregation: Excels in collecting and managing bug reports, presenting them in a readable format, and facilitating efficient issue resolution.
- Performance Monitoring: Offers performance monitoring capabilities, enabling users to track application performance metrics and identify areas for optimization.
- Sentry Integration: Seamlessly integrates with Sentry's open SDK, ensuring compatibility and versatility in error reporting and aggregation.
- Hosted or Self-Hosted Options: Provides users with the choice between hosted and self-hosted deployment options, offering flexibility to accommodate different deployment preferences.
Why do we recommend it?
GlitchTip stands out as a top recommendation due to its open-source nature, providing users with transparency, flexibility, and a robust community-driven support system. Unlike some proprietary solutions, GlitchTip offers a substantial body of support and resources, thanks to its open-source ecosystem. Our experience with GlitchTip has demonstrated its effectiveness in collecting and managing bug reports, presenting them in a readable format, and facilitating efficient issue resolution. Moreover, GlitchTip's integration with Sentry's open SDK ensures compatibility and versatility, making it a versatile and reliable choice for error reporting and aggregation needs.
Who is it recommended for?
GlitchTip is recommended for developers and businesses seeking a reliable error reporting tool with a focus on open-source solutions. Its open-source nature makes it particularly appealing for users who prioritize transparency, community support, and customization options. Whether you prefer a hosted solution or self-hosting, GlitchTip offers flexibility to accommodate different deployment preferences. While it may be relatively new, GlitchTip's lightweight architecture and affordability make it an excellent choice for small businesses, startups, and budget-conscious projects where open-source principles are valued. In summary, GlitchTip is an ideal solution for anyone looking for a cost-effective and community-driven approach to error reporting and performance monitoring.
The solution was seemingly created as an answer to Sentry moving away from open-source, but it still integrates with Sentry’s open SDK. Because the solution is open-source, you can host it locally, but the company also offers host options. Glitchtip is still relatively new but may be the perfect solution for small businesses or budget projects where open-source is essential.
Pros:
- Completely Open-Source Project: Open-source nature ensures transparency, community-driven development, and flexibility for users.
- Offers Both Hosted and Self-Hosted Options: Provides users with the flexibility to choose between hosted and self-hosted deployment options, catering to diverse deployment preferences.
- Extremely Lightweight: Lightweight architecture ensures minimal resource consumption, making it suitable for deployment in various environments with minimal overhead.
Cons:
- Interface Could Use Improvement: While GlitchTip offers robust functionality, some users may find that the interface could benefit from enhancements in terms of user experience and visual design.
GlitchTip is open source and completely free when self-hosted. You can also use their hosted platform, which is also free for up to 1000 events.
Beyond the free hosted option, they also have services available for small, medium, and large businesses. The Small package supports up to 100k events and costs $15 per month. The Medium package supports up to 500k events and costs $50 per month. Finally, the Large package supports up to 3 million events and costs $250 per month.
9. Komodo IDE
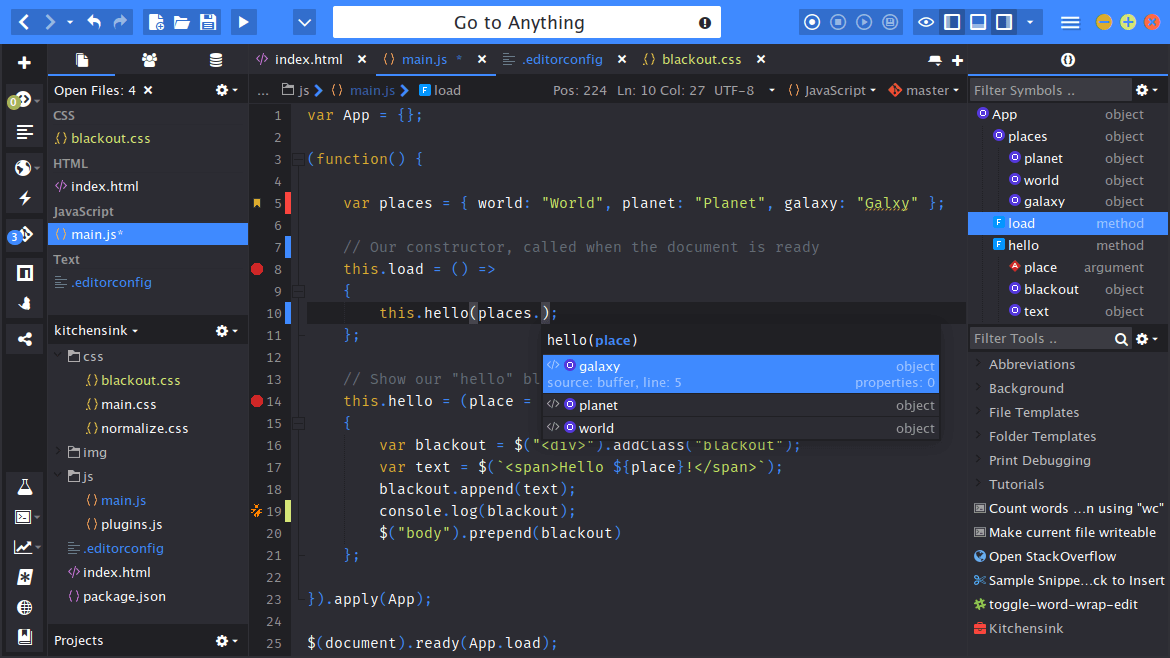
Komodo is another IDE, but one that can handle a variety of languages, including Python. Komodo is open source, and the base version of the product is also completely free. The IDE excels in debugging as the visual debugger and code inspection tools that improve error detection and prevent problems.
Key Features:
- Open-Source IDE: Open-source integrated development environment, offering transparency, flexibility, and a vibrant community-driven ecosystem.
- Inbuilt VCS Integration: Provides inbuilt support for version control systems (VCS) like Git, enabling seamless collaboration and code management within teams.
- Visual Debugger: Enhances error detection and prevention, facilitating efficient debugging of code.
- Workflow Management: Offers robust workflow management tools, enabling developers to streamline development processes and prevent buggy builds from being delivered.
- Multi-Language (Including Python): With support for multiple languages, including Python, Komodo IDE caters to diverse development needs and project requirements.
Why do we recommend it?
Komodo IDE earns our recommendation for its versatile capabilities in handling multiple languages, including Python, coupled with its open-source nature and free base version. The IDE excels in debugging, offering a visual debugger and code inspection tools that enhance error detection and prevention. Our experience with Komodo IDE has highlighted its effectiveness in streamlining development workflows, thanks to its inbuilt support for version control systems (VCS) like Git, and robust workflow management tools. With its multi-language support and comprehensive debugging capabilities, Komodo IDE stands out as an invaluable tool for developers seeking an efficient and customizable integrated development environment.
Inbuilt support for VCS like Git and workflow management tools mean you can prevent buggy builds from being delivered. The real draw of Komodo is the open-source nature of the product, with extensive support and expansion capabilities as a result. If you need a new IDE for Python development, this solution will provide many tools to enhance your debugging capabilities.
Who is it recommended for?
Komodo IDE is recommended for developers seeking a feature-rich and customizable IDE for multi-language development, particularly Python. Whether you're a beginner or an experienced developer, Komodo IDE's intuitive interface and extensive feature set cater to diverse skill levels and project requirements. Its open-source nature and free base version make it an attractive option for developers looking for cost-effective solutions without sacrificing functionality. While it excels in supporting Python development, its support for multiple languages and robust debugging features make it suitable for a wide range of development projects. If you're in need of a reliable IDE with comprehensive debugging capabilities for Python and beyond, Komodo IDE is an excellent choice.
Pros:
- Support for Multiple Languages: Offers comprehensive support for Python development, along with support for various other programming languages, enhancing flexibility and versatility.
- Open-Source-Based Tool: Open-source nature ensures transparency, community-driven development, and extensive support and expansion capabilities.
- Supports Visual Debugging: The visual debugger in Komodo IDE provides a user-friendly interface for debugging code, simplifying the process of error detection and resolution.
Cons:
- Not Ideal for those Looking to Avoid Open-Source Solutions: While Komodo IDE's open-source nature offers numerous benefits, some users may prefer proprietary solutions, which may not align with their preferences or requirements.
The software can be downloaded and installed from the company website, but you must have an ActiveState account to use the product, including the free version. Unfortunately, it seems ActiveState is slowly phasing out the IDE and rolling it into the ActiveState platform.
The IDE still has a community following, and since the solution is free and open source, it’s worth considering if you need a solution while on a budget. However, be aware that while the product is still supported, it seems to be gradually declining compared to more recent solutions.
10. Icecream
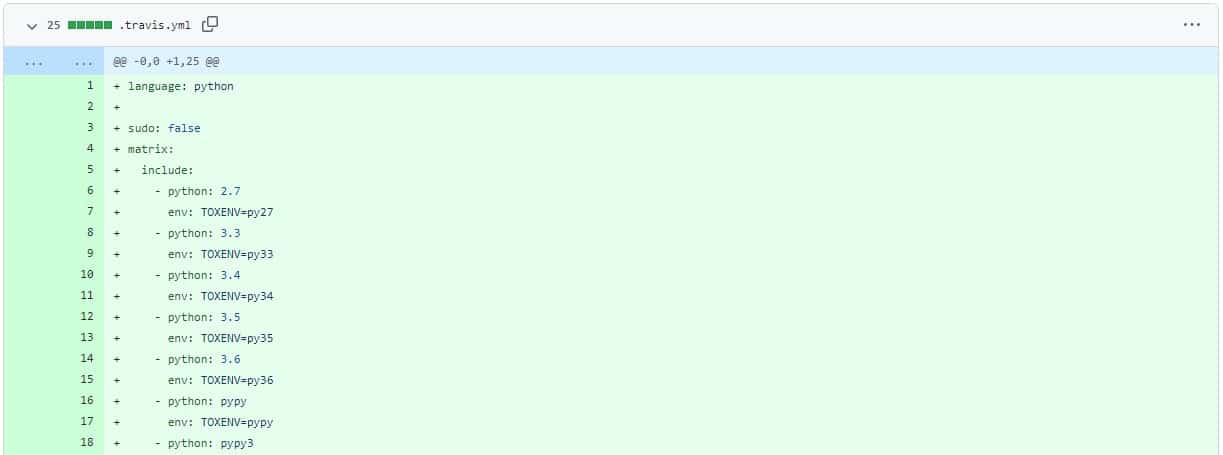
Icecream is designed as an alternative to the print() function, it expands on the amount of information provided by the typical output function making it a handy tool for detailed debugging. The solution has several uses, from more detailed inspection of variables to better execution feedback.
Key Features:
- Enhanced print() Function: Offers an enhanced alternative to the traditional print() function, providing expanded information for detailed debugging.
- Free and Open Source: Free and open-source project, ensuring accessibility and flexibility for developers seeking improved debugging tools.
- Pip Installed Package: Easily installed through pip, allowing for seamless integration into existing Python projects with minimal effort.
Why do we recommend it?
Icecream earns our recommendation as a valuable tool for detailed debugging, offering an enhanced alternative to the traditional print() function. Unlike standard output functions, Icecream provides expanded information, making it particularly useful for inspecting variables and receiving better execution feedback during debugging sessions. Our experience with Icecream has demonstrated its effectiveness in enhancing debugging capabilities without requiring a drastic overhaul of existing methodologies. With its free and open-source nature, Icecream offers accessibility and flexibility, catering to developers of all levels seeking improved debugging tools.
The plugin can be installed through pip with minimal effort. While this solution doesn’t present a drastic overhaul of your debugging methodology, it gives your debugging abilities a little extra bump that they might need.
Who is it recommended for?
Icecream is recommended for developers seeking a lightweight and efficient debugging tool that enhances the traditional print() function. Whether you're a beginner or an experienced developer, Icecream's straightforward installation process and intuitive usage make it accessible to developers of all skill levels. While it may not offer an extensive set of features found in other debugging products, Icecream provides a simple yet effective solution for enhancing debugging capabilities with minimal effort. If you're in need of a free and lightweight debugging tool that offers a little extra bump in debugging abilities, Icecream is an excellent choice.
Pros:
- Completely Free: Completely free debugging tool, offering valuable debugging capabilities without any financial cost.
- Open-Source Project: Open-source nature ensures transparency, community-driven development, and potential for customization and expansion.
- Extremely Lightweight: Extremely lightweight debugging tool, ensuring minimal impact on performance and resource consumption during debugging sessions.
Cons:
- Lacks Features Found in Other Products: While Icecream offers valuable debugging capabilities, it may lack some of the advanced features found in other debugging products, limiting its suitability for complex debugging scenarios.
Python debugging tools FAQs
Is there a Python debugger?
There is a native debugger module for Python, which is called pdb – Python Debugger. This is a command line utility. The procedures of pdb require you to embed debug message lines in your code. These are specific to pdb so you can leave them in your code even when it goes live and the output won’t appear under normal running conditions. However, the messages can be collected whenever you run pdb and launch the Python script within the utility.
Why we use debugging in Python?
Debugging is a way to detect and correct errors. However, there are other purposes for debugging. It is often difficult to be able to work out why the final output of a program is coming out wrong or why a program that used to work, suddenly falls over without any code changes. Investigating these situations is made easier by inserting status report messages at sequential points in the Python script. With these traces, you can read through the debug messages and detect the point in the code where activities start to diverge from expected behavior or see where interactions with other modules or resources cause previously unexpected errors.
What is PyCharm used for in Python?
PyCharm is an integrated development environment (IDE) for Python. That is, it is a code editor that is specifically tuned to Python syntax. As it has a dictionary of Python functions built into it, the PyCharm system will highlight functions, and ensure that the variables given for each conform to the schema for that service. The IDE will also assist with clear formatting of code and link between newly written modules that call each other to verify cohesion.
