Custom alerts and data visualization let you quickly identify and prevent issues with data center operations and outages.
Data centers are at the heart of every IT infrastructure and mission-critical in every company.
The infrastructure of most data centers is composed of heterogeneous devices, applications, and services from different manufacturers and providers. Keeping an overview of all these aspects is no easy task for IT teams.
Our PRTG data center monitoring solution helps with this task and makes sure that your data center works optimally.

The more complex your data center, the harder it is to know if everything works as expected. PRTG provides you with a central overview that consolidates any data center monitoring data in easy-to-read dashboards. You can also create your own customized maps and dashboards that show you all important metrics in one view – even of distributed data centers.
Once you have set up your data center monitoring in PRTG, you can sit back and relax. If any issue or error occurs in your data center, PRTG instantly alerts you via highly customizable alerts and notifications. You can not only set custom threshold values but also choose the way you want to be informed – whether by email, SMS, push notification, Teams or Slack message, and more.
Everything in your data center is running smoothly? Great! With Paessler PRTG, you can see at one glance that there are no problems in your data center and focus on other areas of your work.
Every minute of downtime in your data center can cost your company thousands of dollars. Thus, high availability of all your data center components is vital for your business success.
What’s more: with PRTG, you can prevent errors and downtimes even before they occur. If a component in your data center infrastructure fails, PRTG shows you the cause of the error so that you can quickly fix it.
PRTG not only monitors your data center in real time but also records all important performance data. You therefore get detailed information about your data center whenever you want it: How high was the overall uptime during the last 12 months? What about bandwidth usage?
With the comprehensive reporting system of PRTG, you can also identify data usage trends in your data center. This way, you can decide more easily where more capacity is needed or where you can save resources. Data center monitoring reports help you to:
Diagnose network issues by continuously tracking your data-center's on-premises or cloud-based infrastructure. Show availability, hardware parameters, network performance, unusual network activity, unauthorized access, and other key metrics in real time. Visualize monitoring data in clear graphs and dashboards to identify problems more easily. Gain the overview you need to troubleshoot data center issues and enhance performance and security.
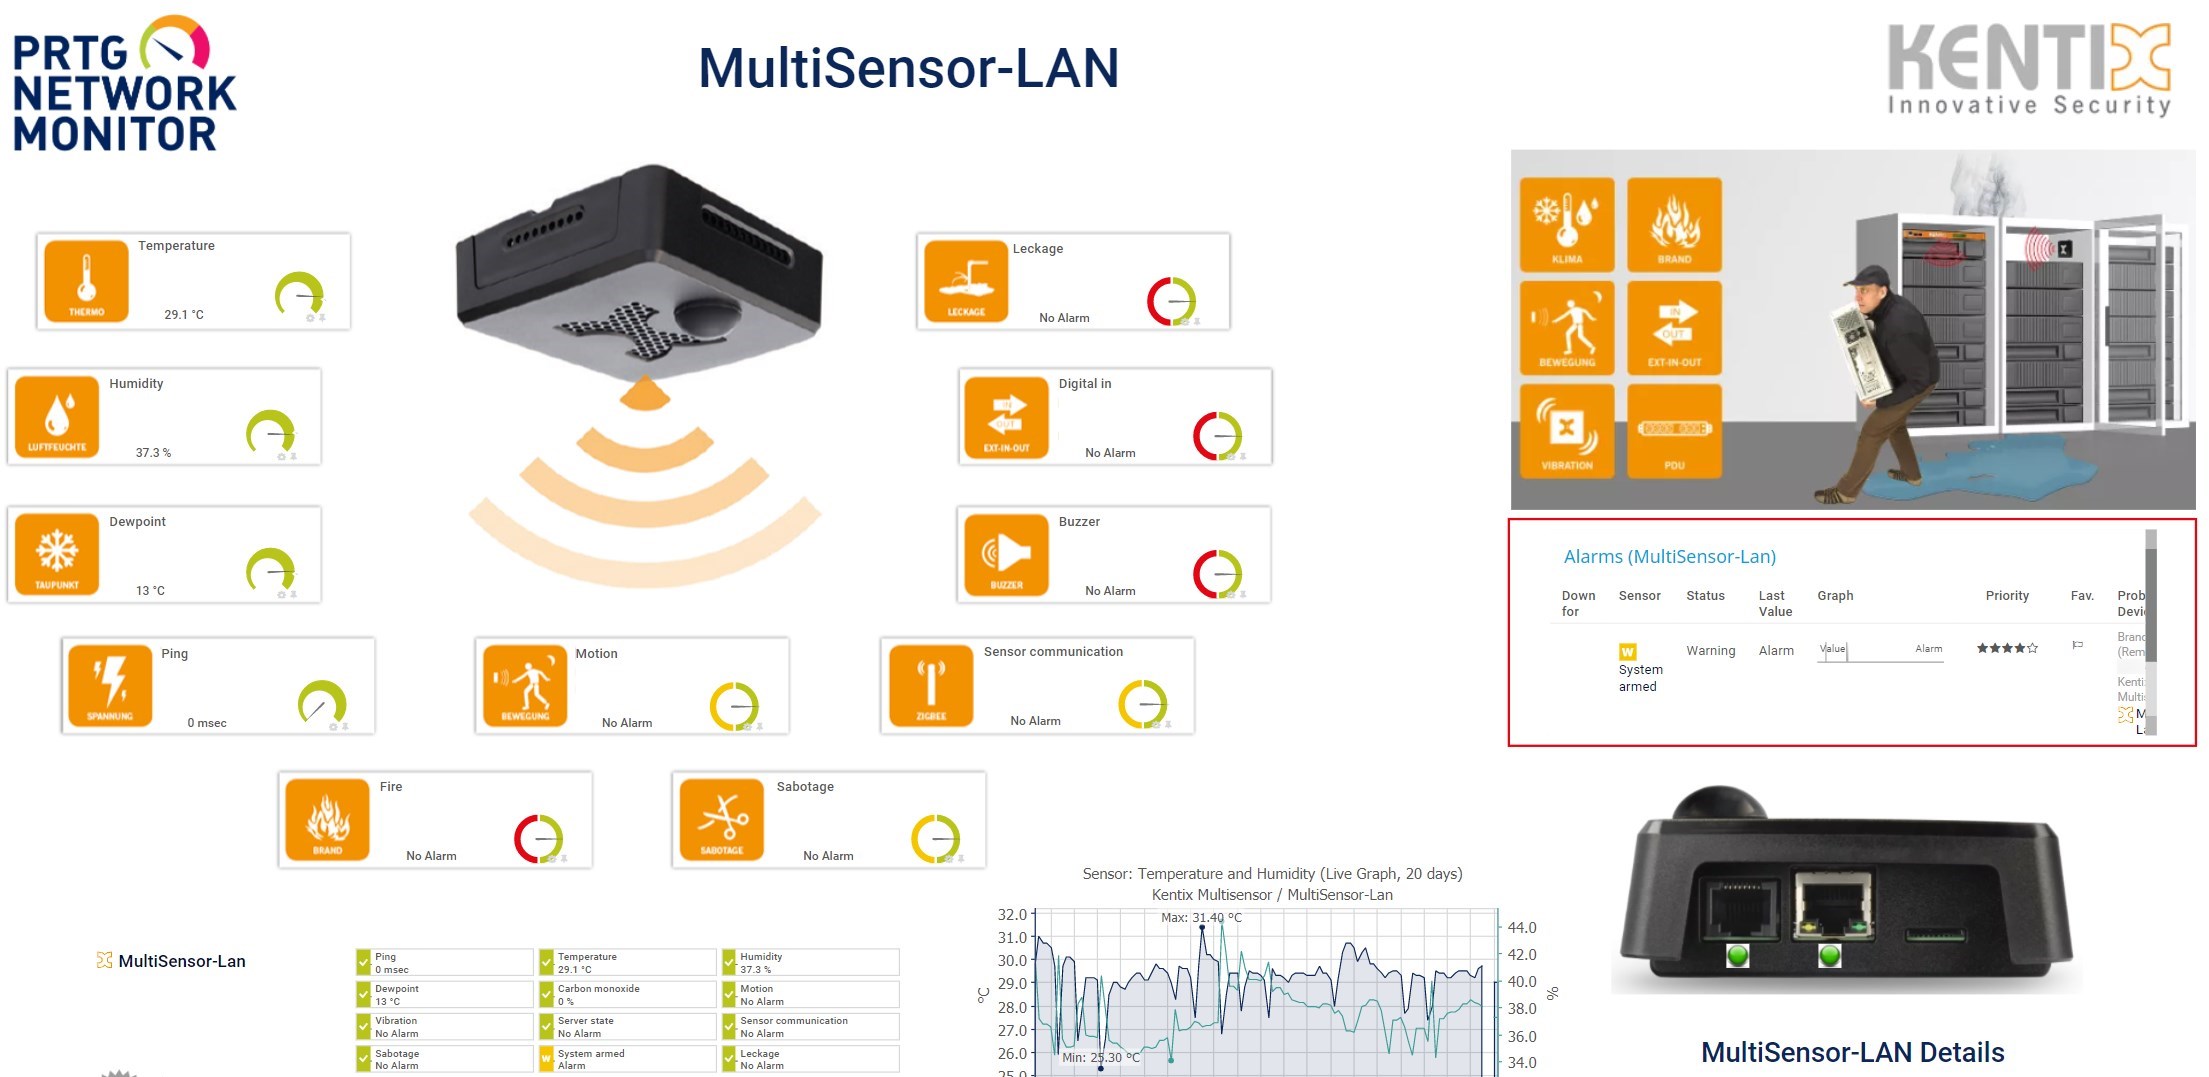
Custom Kentix data center map

Device tree view of the complete monitoring setup
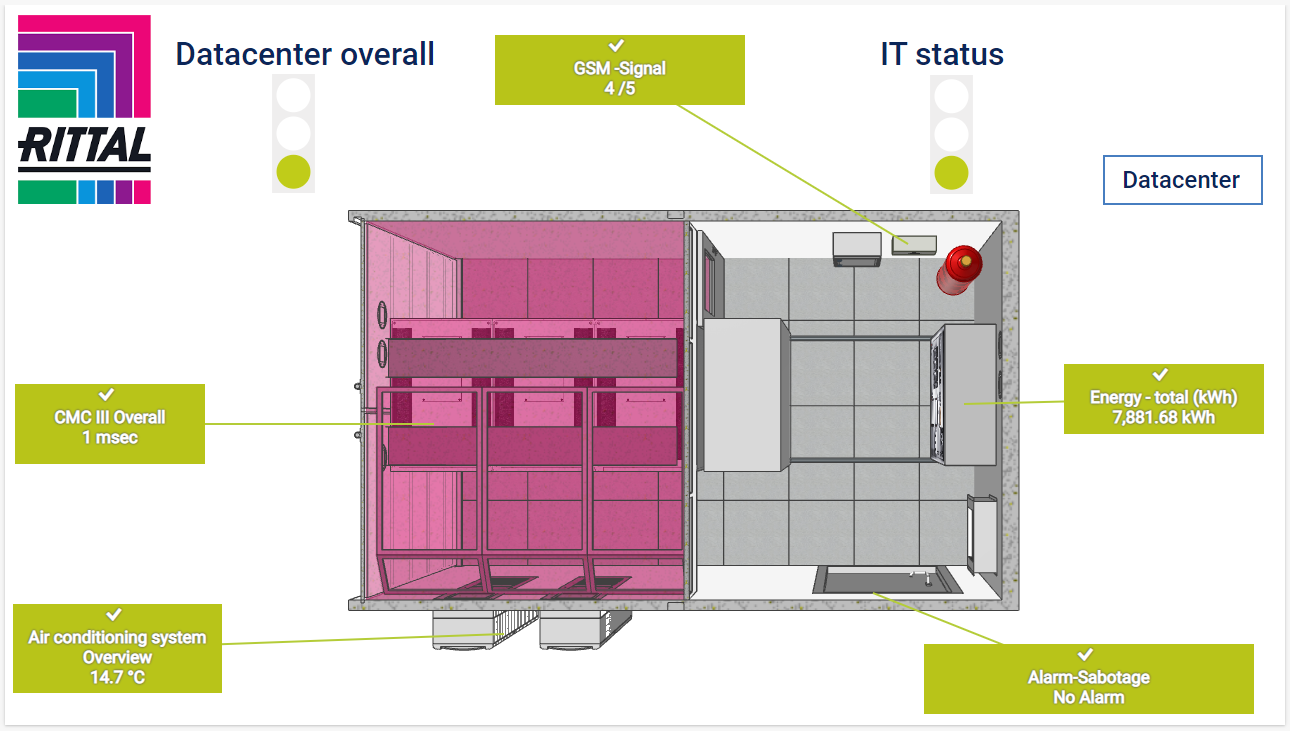
Custom PRTG map for Rittal data center
Custom Kentix data center map
Device tree view of the complete monitoring setup
“All-around winning
network monitor”
“The real beauty of PRTG is the endless possibilities it offers”
“PRTG Network Monitor
is very hard to beat”
Data centers are way more than a bunch of computers in a room. Thus, data center monitoring goes beyond traditional IT and network monitoring. In fact, a data center can be seen as an entity composed of three main blocks, which you can all monitor with PRTG.
Keep track of all applications and services which are hosted in your data center, for example, web servers (IIS, Apache), SQL servers (Microsoft SQL Server 2005-2016, Oracle, MySQL, PostgreSQL), mail servers (Exchange, IMAP, POP3, SMTP), web applications (websites, portals), backups, security, and customer-specific applications.
Most data centers host critical information and run applications that businesses and individuals rely on for their daily work. As a result, it is crucial to maintain an optimal data center environment. This involves monitoring metrics such as temperature, humidity, smoke, the energy supply, and even physical security in server rooms.
Got a few sensors left to spare? Set up network monitoring that’s lightweight yet powerful. Paessler PRTG not only monitors your data center, but also your complete IT infrastructure.
How much traffic passes through your network? When and where do spikes in traffic occur? How does your traffic change over time? PRTG tells you all this and more. As a result, you can take all the necessary precautions to ensure that your network is running at optimal capacity. Find out more about bandwidth monitoring with PRTG.
PRTG uses a variety of network protocols for monitoring your entire network, such as SNMP, WMI, SSL, HTTP, FTP, SSH or DHCP. By keeping track of your IT infrastructure via all those protocols you ensure the smooth functioning and optimal performance of your network.
PRTG comes with more than 250 native sensor types for monitoring your entire on-premises, cloud, and hybrid cloud environment out of the box. Check out some examples below!
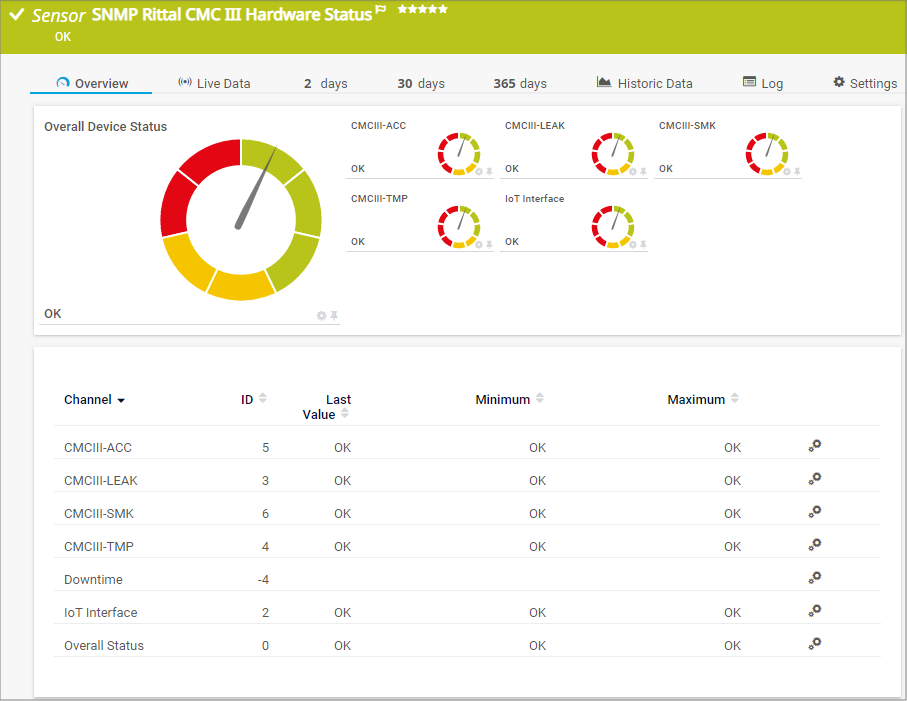
The SNMP Rittal CMC III Hardware Status sensor monitors the overall status of Rittal data center hardware, for example Rittal Computer Multi Control version 3 (CMC III) processing units, Rittal power distribution units (PDU), or Rittal IoT interfaces. It can show the following:
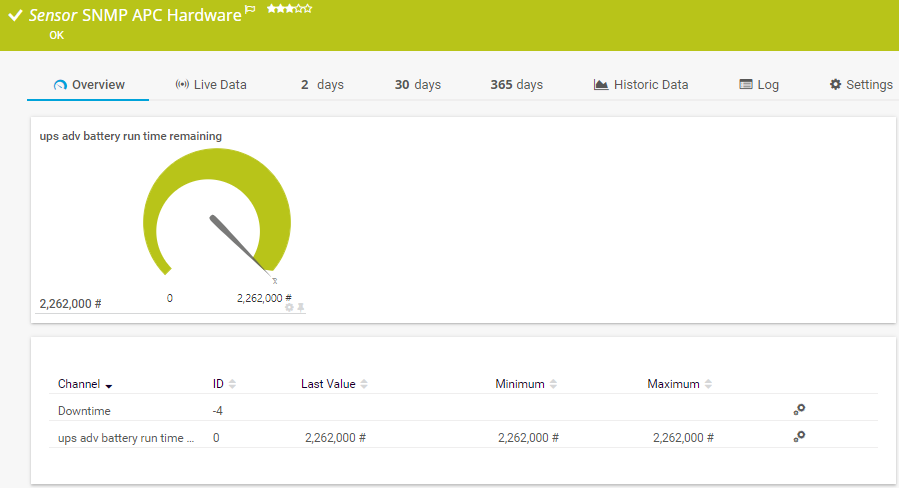
The SNMP APC Hardware sensor monitors performance counters on an APC UPS device. It can show the following:
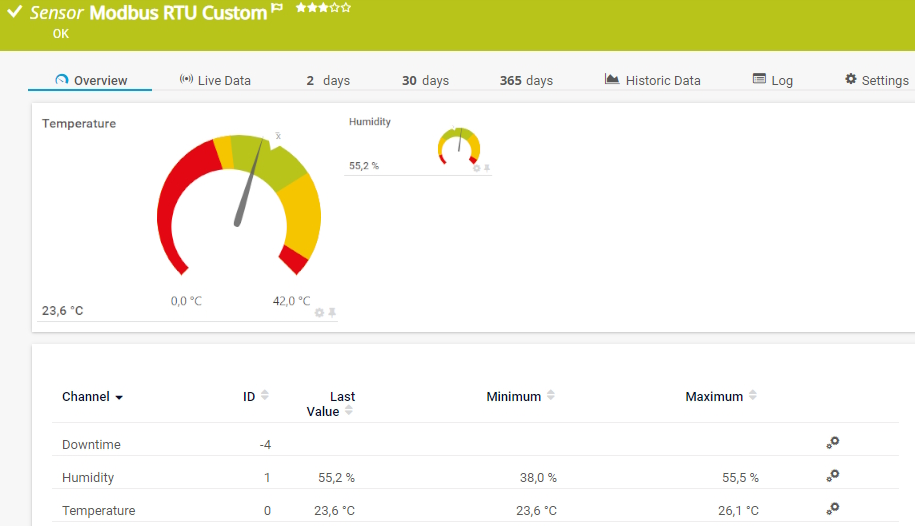
The Modbus RTU Custom sensor connects to a Modbus Remote Terminal Unit (RTU) server and monitors up to ten returned numeric values. It can show the following:
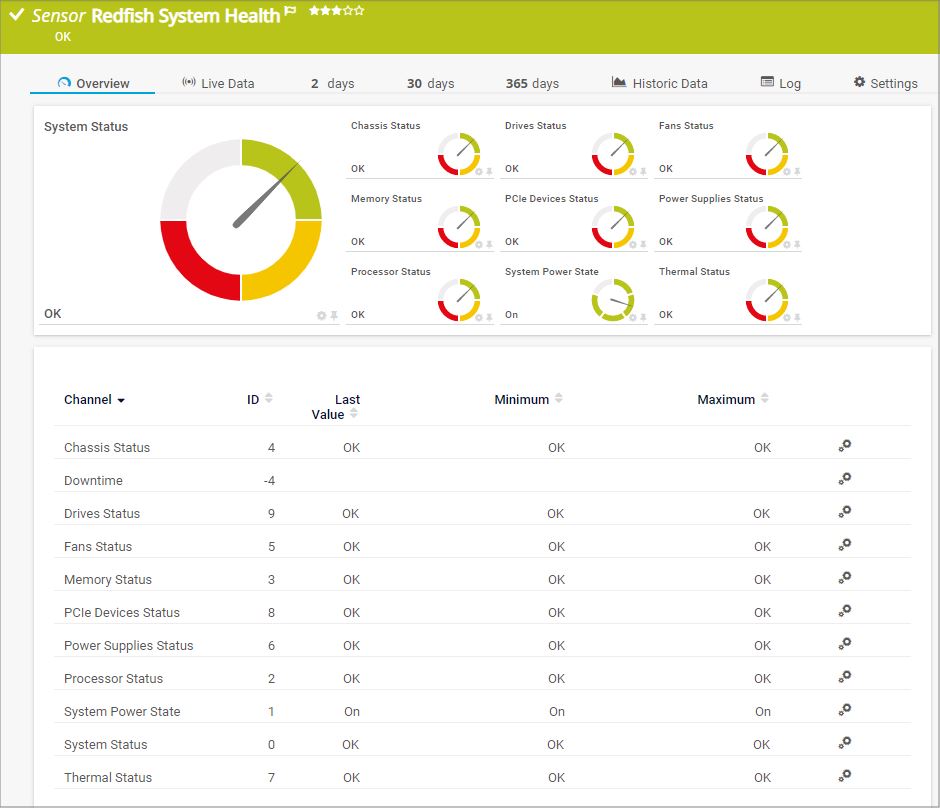
The Redfish System Health sensor monitors the system health of a Redfish Scalable Platforms Management API (Redfish)-capable server. It can show the following:
See the PRTG Manual for a list of all available sensor types.

Custom alerts and data visualization let you quickly identify and prevent issues with data center operations and outages.
PRTG is set up in a matter of minutes and can be used on a wide variety of mobile devices.


“Excellent tool for detailed monitoring. Alarms and notifications work greatly. Equipment addition is straight forward and server initial setup is very easy. ...feel safe to purchase it if you intend to monitor a large networking landscape.”
Partnering with innovative IT vendors, Paessler unleashes synergies to create
new and additional benefits for joined customers.

Combining their tools to a powerful solution for advanced analysis and automation, KnowledgeRiver and Paessler enable IT teams to ensure best performance for their infrastructure and networks.

Paessler and Plixer provide a complete solution adding flow and metadata analysis to a powerful network monitoring tool.
IT that works constitutes a business-critical basis for a company's success. Availability and security must be defined for the respective purpose and closely monitored – by OT and IT alike.
Real-time notifications mean faster troubleshooting so that you can act before more serious issues occur.
Network Monitoring Software – Version 25.1.104.1946 (March 18th, 2025)
Download for Windows and cloud-based version PRTG Hosted Monitor available
English, German, Spanish, French, Portuguese, Dutch, Russian, Japanese, and Simplified Chinese
Network devices, bandwidth, servers, applications, virtual environments, remote systems, IoT, and more
Choose the PRTG Network Monitor subscription that's best for you


Data center monitoring refers to the process of collecting and analyzing data about the performance and operation of a data center's physical infrastructure, systems, and applications. The main goal of data center monitoring is to ensure that the data center is operating efficiently and effectively and to detect any potential issues before they become major problems.
You can monitor distributed data centers with PRTG using remote probes or setting up multiple PRTG servers. All monitoring data that you collect from your distributed data centers can be visualized on one single dashboard, which makes it way easier to keep track of your data center infrastructure and environment.
In PRTG, “sensors” are the basic monitoring elements. One sensor usually monitors one measured value in your network, for example the traffic of a switch port, the CPU load of a server, or the free space on a disk drive. On average, you need about 5-10 sensors per device or one sensor per switch port.
Paessler conducted trials in over 600 IT departments worldwide to tune its network monitoring software closer to the needs of sysadmins. The result of the survey: over 95% of the participants would recommend PRTG – or already have.

Paessler PRTG is used by companies of all sizes. Sysadmins love PRTG because it makes their job a whole lot easier.
Bandwidth, servers, virtual environments, websites, VoIP services – PRTG keeps an eye on your entire network.
Everyone has different monitoring needs. That’s why we let you try PRTG for free.