We may earn a commission if you make a purchase through the links on our website.
Grafana 2025 Beginner’s Guide
UPDATED: October 23, 2023
Grafana is the king of dashboards and visualizations within the monitoring solutions realm. Its dashboards are so powerful and easy to set up that they are “almost” a de facto standard for monitoring. Grafana is used internationally by companies of all sizes, individuals, and in all sorts of industrial and agricultural use cases. Grafana has even been used internally by the SpaceX control center and Microsoft.
Table of Contents
- Introduction to Grafana
- Grafana’s Strengths and Limitations
- How to Start with Grafana?
- How to Add Data Sources and Configure a Dashboard in Grafana
- Grafana FAQ
1. Introduction to Grafana
In this beginner’s guide, you will learn the basics of Grafana and a few simple steps to get started. You will learn how Grafana works, how to use it, and how to configure it. We will walk you through the installation and deployment process of the Grafana Stack.
What is Grafana?
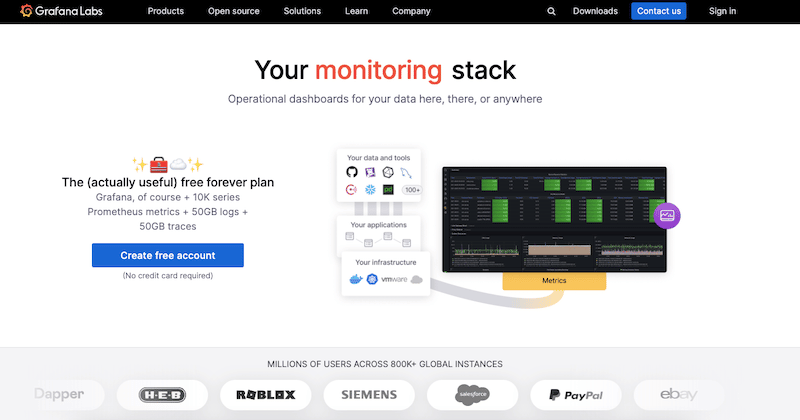
Grafana is an open-source visualization and analytics platform developed by Grafana Labs. It integrates with third-party tools to collect and store time-series data from different environments, including traditional servers, cloud services, virtual machines, Kubernetes clusters, and more.
The beauty of Grafana is that it allows its users to explore, visualize, query, and alert on this collected data (logs, metrics, and traces) through easy-to-use operational dashboards. Grafana can understand these data sets regardless of storage location.
Grafana Background
Grafana was developed by Torkel Ödegaard in 2013 with the idea of creating something similar to Kibana but focusing on time-series data. The goal was to make time-series data more accessible to everyone who wanted to create beautiful graphs and dashboards based on that data. He met two other entrepreneurs, Raj Dutt and Anthony Woods, and the three started a company based on Grafana. Around 2015, Grafana Labs was born and soon released Grafana v.2.0 (which has remained open-source since then). Grafana was quickly adopted by different organizations and individuals in a large variety of industries. Since then, Grafana has become one of the favorite monitoring tools, primarily due to its ease of use and visually appealing dashboards.
As Grafana OSS (Open Source Software) started to be adopted by large organizations, Grafana Labs quickly introduced two new commercial products, Grafana Enterprise and Grafana Cloud.
Product Details
- Licensing Grafana has an open-source license under the Affero General Public License version 3.0 (AGPLv3). You can find all source code in its main repository: github.com/grafana/grafana
- Operating system support The Grafana Backend is supported by Debian / Ubuntu, RPM-based Linux (CentOS, Fedora, OpenSuse, Red Hat), macOS, and Windows.
- Pricing plan Grafana (Open Source Software – OSS) for visualization is free forever and unlimited. You can also use it free with Prometheus (10K series metrics) + 50 G Blogs and 50 GB traces. Grafana also offers Grafana Cloud (fully managed for free or starting at $8/month) and Grafana Enterprise (self-managed). Contact Grafana sales for pricing on the enterprise stack.
- Other Grafana Labs tools Grafana Labs also provides the Core LGTM Stack that covers Logs (Grafana Loki), Grafana (visualization), Traces (Grafana Tempo), and Metrics (Grafana Mimir and Prometheus).
- Grafana integrations and expansion Grafana can be connected with other data sources or applications via its plugins. It can also be expanded with Grafana alerting, incident, and on-call capabilities. In addition, you can also use the Grafana k6 for performance testing.
- Support The only way to get technical support for Grafana OSS is via its public forums. Plus, there is also excellent documentation and a knowledge base. The support for Grafana Pro and advanced accounts is more dedicated. You can open support tickets (via Cloud Portal) and contact support via email.
- Free Trial Sign up for a 14-day free trial of Grafana Pro (Cloud) or download Free (limited) Forever Cloud.
How Does Grafana Work?
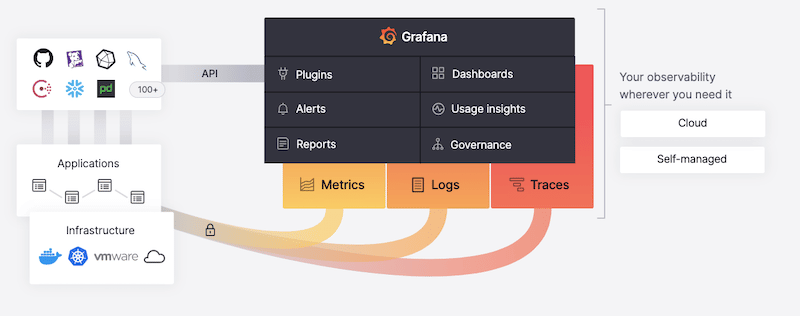
Grafana uses the server-client architecture. The Grafana backend (server) can be self-managed via Grafana OSS Stack or Enterprise or fully managed via the Grafana Cloud. The Grafana server collects telemetry data (metrics, logs, and traces) from your infrastructure or applications using data sources or Grafana agents (clients). The server provides different services for this data, including analysis, graphing, alerting, reporting, and governance.
Grafana does not collect or store data, so it needs external data sources such as InfluxDB, Azure Monitor, Amazon CloudWatch, and Microsoft SQL Server, which can be easily integrated with Grafana. In addition, the Grafana client can also be used as a one-stop solution to collect and deliver telemetry data to the Grafana backend. Grafana can also be integrated using plugins (via API) to other monitoring tools like Prometheus, Splunk, Graphite, and much more.
2. Grafana’s Strengths and Limitations
Strengths of Grafana
- Grafana’s strengths are dashboards and visualizations Grafana offers visually appealing and highly customizable dashboards. Grafana’s interactive data visualization platform allows its users to analyze data easier, track performance, identify trends, and detect irregularities.
- Grafana can monitor multiple clouds One of the most significant advantages of Grafana is that it lets you collect and visualize metrics from the leading cloud providers, including Amazon AWS (CloudWatch), Microsoft Azure (Monitor), and Google Cloud.
- Amazing integrations Grafana can be integrated via plugins with a large and diverse set of third-party tools. Some of the most popular (aside from the cloud data sources) are Prometheus, InfluxDB, MySQL, Splunk, and Elasticsearch. In addition, Grafana also offers integrations via its Grafana agent, which can be installed in Linux hosts, Windows, Nginx servers, Kubernetes clusters, and more.
Limitations of Grafana
- Grafana is limited in data collection and storage Grafana’s software is the best at graphs and dashboards, but it is limited regarding data sources. Although it can collect time series data from particular types of infrastructure or applications on its own (via agents) it still requires different storage backends (as data sources) to feed data into Grafana. So, Grafana depends on other solutions. It needs to be integrated with third-party ‘external’ data sources such as Prometheus, InfluxDB, MySQL, Azure Monitor, or Amazon CloudWatch.
3. How to Start with Grafana?
In this section, we will go through the steps for starting with Grafana. We will install the Grafana backend, begin its configuration, and open the web user interface.
Requirements
Before installing the Grafana OSS server stack, you’ll need to consider the following software and hardware requirements. Grafana can be installed in the following supported operating systems: Linux (Debian/Ubuntu, or RPM-based, CentOS, Fedora, OpenSuse, and Red Hat), macOS, and Windows. Grafana can also run through container-based Docker images or be deployed through Kubernetes clusters.
Grafana requires an updated web browser for its User Interface. It is supported by the newest versions of Chrome, Firefox, Safari, Microsoft Edge, and Internet Explorer 11. In addition, Grafana needs a database to store users, data sources, and dashboard information. It supports SQLite 3, MySQL 5.7+, and PostgreSQL 10+.
Regarding the hardware requirements, Grafana recommends a minimum memory of 255 MBs and CPU 1.
Install Grafana (Server)
We will start by installing Grafana’s dependencies, proceed to download and install Grafana, and ensure the service is up and running.
NOTE: For illustration purposes, we will install the latest Grafana OSS version on an Ubuntu (22.04) server through the APT repository. Installing Grafana from the APT repository guarantees that Grafana is updated every time you issue an ‘apt-get update’ command. Note that you can also install Grafana from the .deb package or the binary .tar.gz file.
-
- Download Grafana from its official APT repository. We will download the Grafana OSS stable release.
- Use the following commands to install the dependencies.
$ sudo apt-get install -y apt-transport-https
$ sudo apt-get install -y software-properties-common wget
$ sudo wget -q -O /usr/share/keyrings/grafana.key https://packages.grafana.com/gpg.key
- Since we are installing the latest stable release (and not beta), we will add the stable release repository
$ echo "deb [signed-by=/usr/share/keyrings/grafana.key] https://packages.grafana.com/oss/deb stable main" | sudo tee -a /etc/apt/sources.list.d/grafana.list
- Let’s install the latest Grafana OSS release
$ sudo apt-get update
$ sudo apt-get install grafana
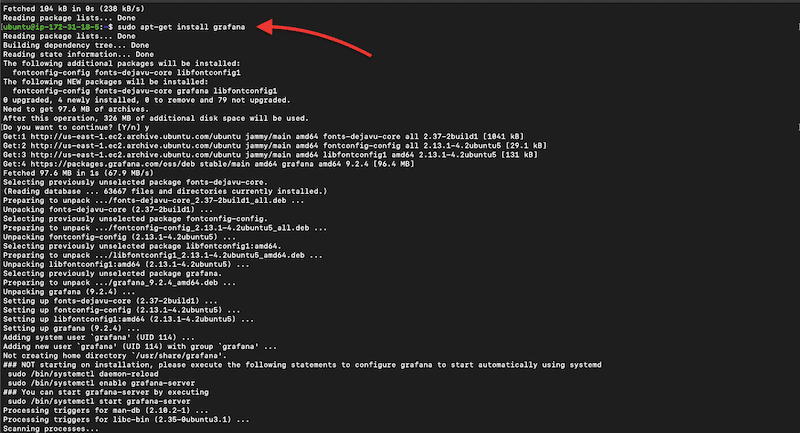
- Now, let’s start the Grafana-server process. We will start the server and verify its state using the following set of commands:
$ sudo systemctl daemon-reload
$ sudo systemctl start grafana-server
$ sudo systemctl status grafana-server
- Make sure the server is active and running
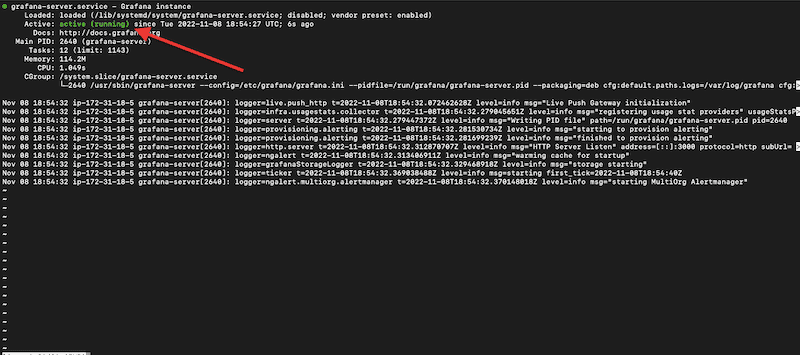
- To ensure the service stays active, let’s configure the Grafana server to start at boot with the following command.
$ sudo systemctl enable grafana-server.service

Configuring Grafana
You can start configuring Grafana through its “configuration files” or by using environmental variables. Grafana comes with default config files, which you can customize by adding custom options and removing the comments from different sections within the configuration file.
- The location of this configuration file will vary from OS to OS. For our Linux Ubuntu instance, the custom configuration file can be found on /usr/local/etc/grafana/grafana.ini.
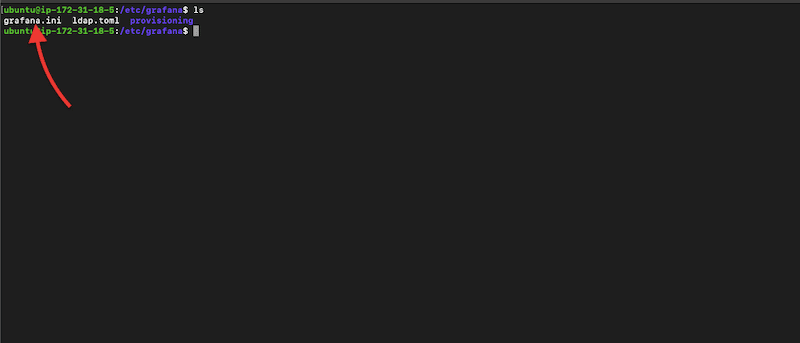
- While in the directory ‘/usr/local/etc/grafana/’ open the grafana.ini using your favorite text editor.
$ sudo vi grafana.ini
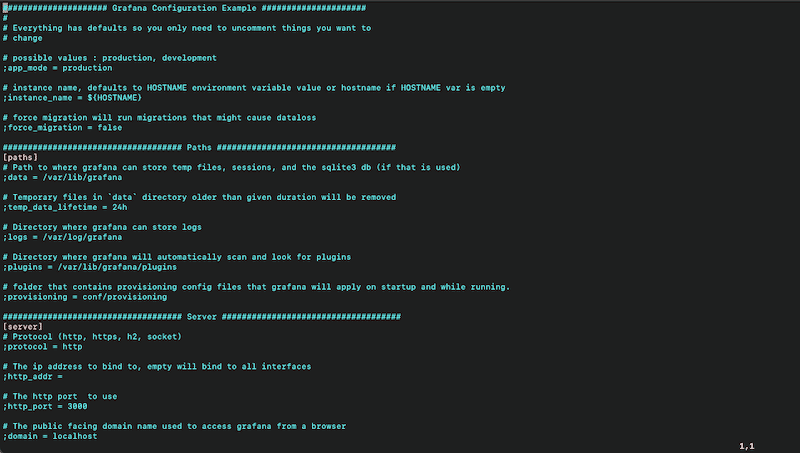
- You can change the parameters in this Grafana configuration file (grafana.ini) by removing the comments. Grafana uses the semicolons (;) as comments in the grafana.ini file. To enable a line of configuration, you’ll need to remove the semicolon (;).
- As an example, let’s change the Grafana port and public-facing domain.
- If you want to change the default HTTP port (3000) to use when opening the Grafana server, remove the “;” and set the value.
- In addition, you may want to change the public-facing domain name used to access the Grafana server from a browser. Choose any other domain than “localhost”, for your Grafana server.
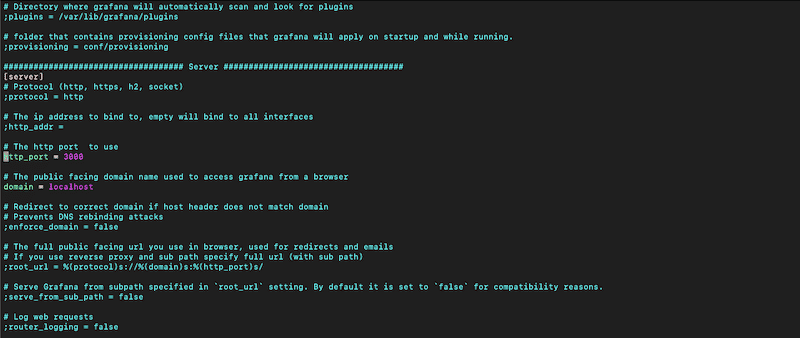
NOTE: Further configuration of the Grafana server is outside the scope of this Beginner’s Guide.
- After making configuration changes on your Grafana server, you'll need to restart it. To restart the services with ‘systemd’ as we did in the previous section, run the following commands:
$ sudo systemctl restart grafana-server
$ sudo systemctl status grafana-server
Opening Grafana for the First Time
To open Grafana’s Web UI, follow the next steps.
- Go to a supported web browser and type the following address: http://localhost:3000. If you have changed the default HTTP port (as shown in the previous section), then use the new port (and not 3000.)
- Enter the credentials If you haven’t changed default values, the default admin user is “admin,” and the password is “admin.” But still, on the first start of Grafana, you’ll be asked to create a new admin password.
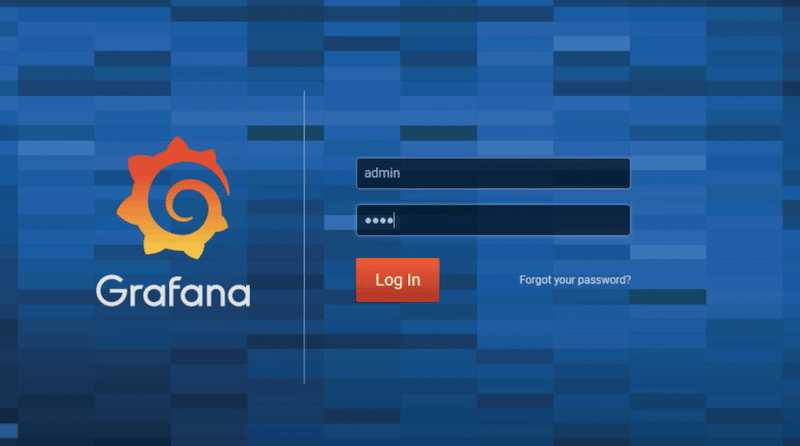
- You’ll still be able to change these credentials by opening the grafana.ini configuration file and changing the values on the “Security” menu (as shown in the screenshot below).

- Once you open the Grafana UI for the first time, it will be empty.
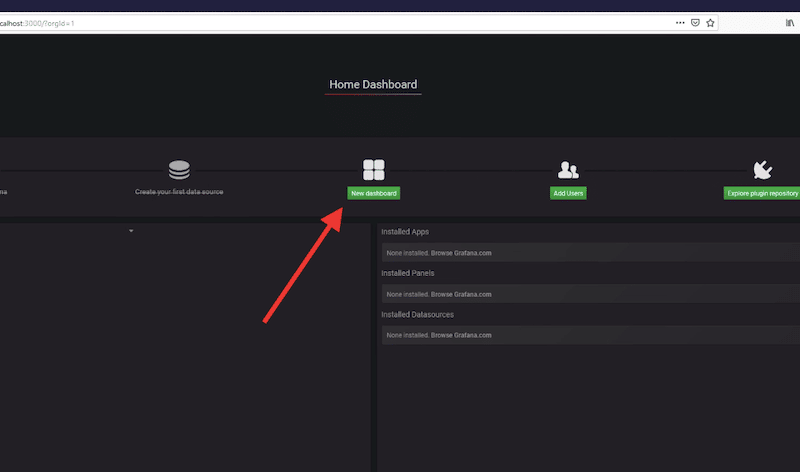
- Refer to the screenshot below. As the configuration flow shows on the Grafana Home Dashboard, after Installing Grafana, you’ll need to “Add a data source,” create a “new dashboard,” “Add users,” and finally, “Integrate with other apps”.
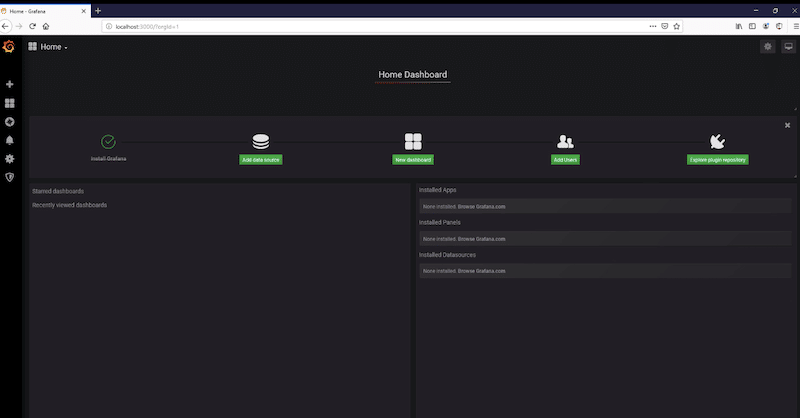
- Once you have Grafana data sources (clients or plugins) sending data to your server (and your server is fully configured), you should start seeing your dashboard with visualizations.
- In the next section, we will add a data source.
4. How to Add Data Sources and Configure a Dashboard in Grafana
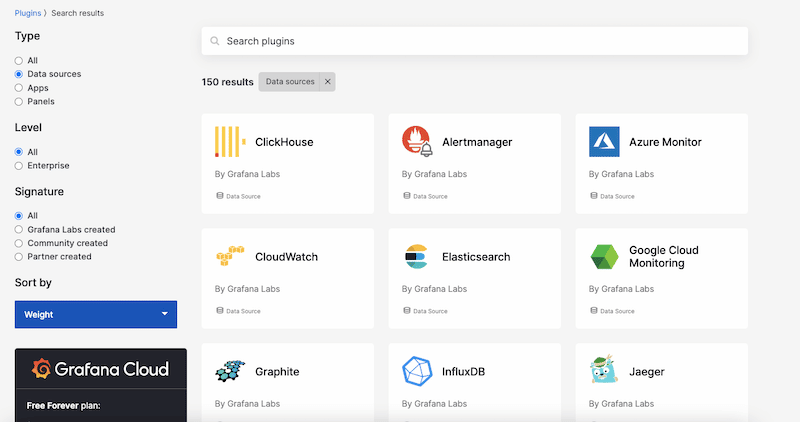
Grafana supports various types of storage backends to collect and store time-series data. Grafana Labs has created many plugins so that you can easily integrate these data sources with Grafana. Popular data sources include Azure Monitor, CloudWatch, Elasticsearch, GoogleCloud Monitoring, Graphite, InfluxDB, MySQL, and more.
Once you have integrated your first data source right from the Grafana UI, you can create dashboards to display this data via visualizations. Keep in mind that each data source has its unique query editor so that you can write specific queries that include the characteristics of the data being monitored.
In addition, although you can combine different data sources into a single dashboard, each panel shown on a dashboard is linked to a specific data source.
Adding a New Data Source on Your Grafana UI
- On the home dashboard, click on the ‘configuration’ on the side menu. Next, click on ‘Data sources’, and ‘Add data source. Or, you can simply click the ‘Add data source’ on the configuration flow.
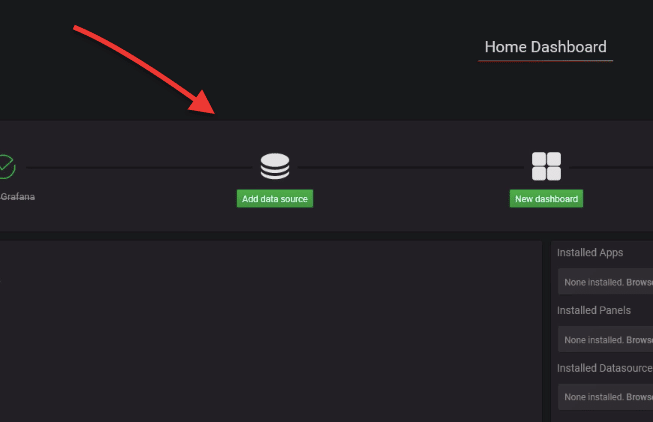
- The following window, “Add data source,” will show you a list of all supported data sources. You’ll find data sources sorted into different categories, including time series databases, logging, and document databases, SQL, distributed tracing, cloud, and more.
- Select the correct data source for your Grafana deployment. If you don’t find a specific data source, search for it using the search dialog.
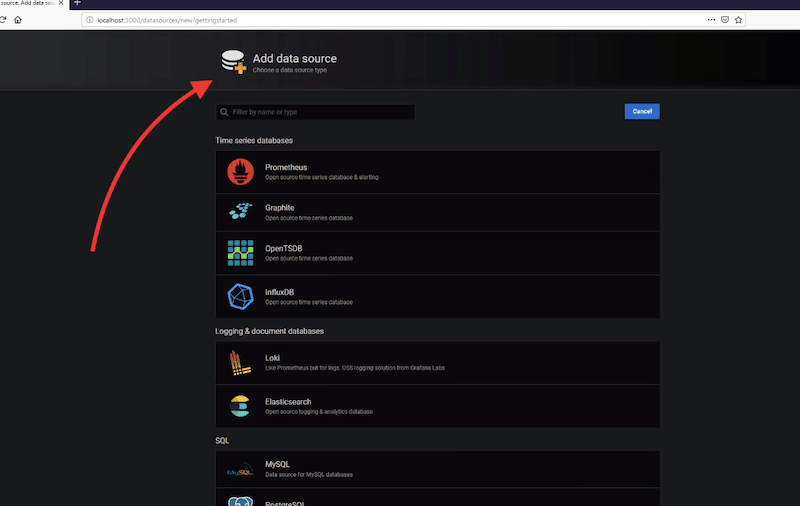
- Click on “Select”, and a new configuration window will open. Fill in all your data source information.
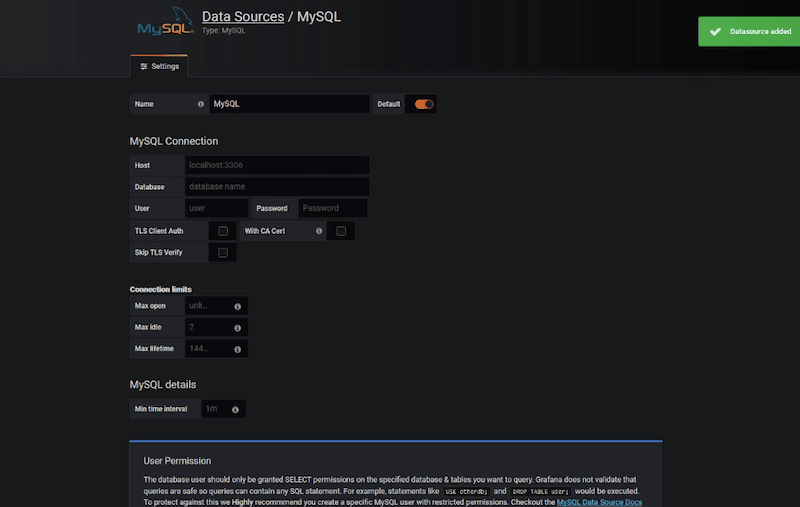
- For instance, to configure MySQL as a data source, you’ll need to give it a name, IP or domain (with the port), database name, credentials, and other settings, such as whether to use TLS or CA certification.
- Click on “Save and Test”.
Configuring Your First Dashboard in Grafana
If you have successfully added a data source in Grafana, now you should be able to add a dashboard that creates visualizations using the data collected from the data source.
- To add your first dashboard in Grafana, click on the “New dashboard” icon in the initial configuration flow.
- Now, you can add new panels with different data sources. As mentioned before, each panel is connected to a single data source. So, to get data to appear in Grafana visualizations, you’ll need to create data source queries. Keep in mind that the query language will vary depending on the data source you are querying.
- Configure your new panel with “Add Query”.
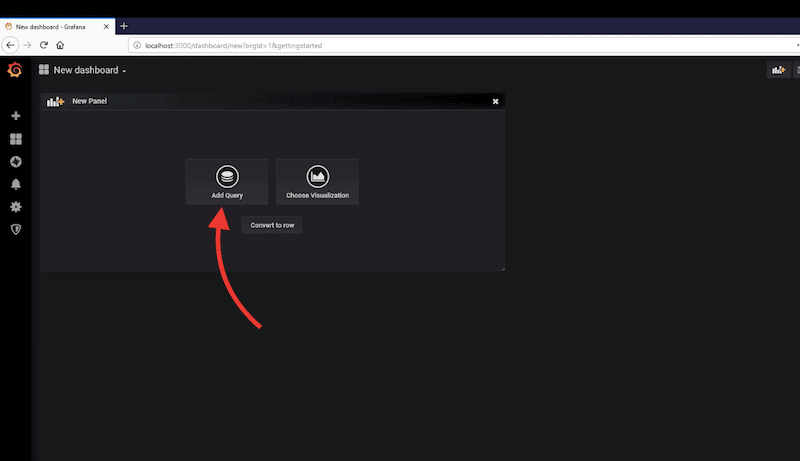
- As you will notice, Grafana creates a brand-new template dashboard that can be fully customized.
- Ensure that you are selecting the correct query for that panel. Click on the drop-down menu next to “Query”. Below you’ll need to set up extra parameters such as timeframes, groups, columns, etc.
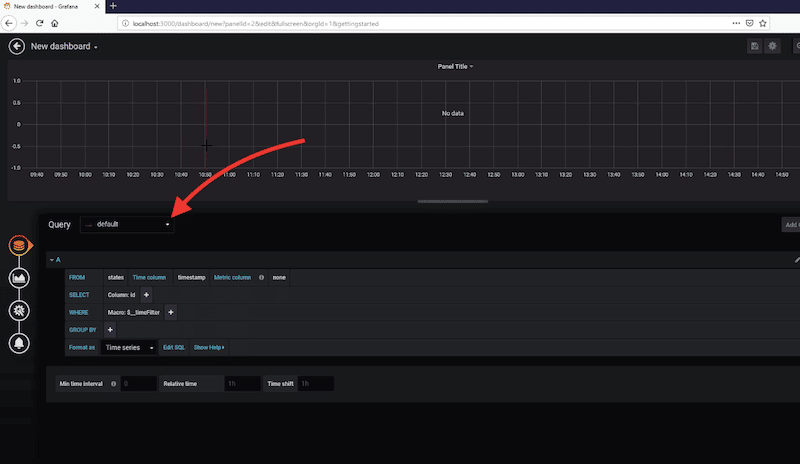
- Detailed configuration of Grafana dashboards is beyond the scope of this guide. For more information on how to configure Grafana dashboards, check Grafana’s official documentation.
Other Ways to Feed Data into Grafana Stack
Although configuring a data source in Grafana is the easiest way to get time-series data into the Grafana server, there are also various advantages to using the Grafana Agent. The Grafana agent collects and sends metrics, logs, and trace data to the Grafana server.
The Grafana agent is built with OpenTelemetry (OTEL)— an observability framework used to generate and capture telemetry data (traces, metrics, and logs) from cloud-native software.
The advantages of using the Grafana agent are:
- The agent can seamlessly collect metrics, logs, and traces for the Grafana Stack.
- The Grafana agent can be used to send telemetry to other compatible endpoints, such as Prometheus.
- The Grafana agent provides out-of-the-box dashboards and alerts.
Another way to get data into the Grafana Stack (Cloud or Enterprise) is by integrating existing monitoring instances from Prometheus, Loki, Tempo, or Graphite. Rather than having distributed instances (and data) for monitoring, Grafana lets you centralize data storage and logging. Grafana can be integrated with these tools to create dashboards that aggregate data, improve queries, and provide alerting across all these separate data sources.
5. Grafana FAQs
Observability vs. monitoring: What are the differences?
Observability is not knowing in advance what will be monitored. It explores the patterns and properties of a system. Monitoring, on the other hand, can be considered a task where predefined sets of metrics and logs are gathered to be monitored for status and health. Grafana can be used for both cases.
What are some alternatives to Grafana?
A good monitoring solution should not only be able to capture and visualize metrics but it should also help troubleshoot, analyze logs, and visualize different components. Some good alternatives to Grafana are Elastic Stack (including Kibana, Logstash, and Elasticsearch), Splunk, and Datadog.
What is not Grafana?
Grafana is not a data collection and storage tool. It does not provide direct data collection and storage as tools like Prometheus.
What are the differences between Grafana and Splunk?
Splunk is a fully featured log analysis software that empowers observability and unified security in distributed and hybrid environments. Grafana, on the other hand, focuses on data visualization. Both tools can work together: Splunk can be configured as a data source (via plugin) to take data into Grafana dashboards and visualize it.
Grafana vs. Prometheus: what are their differences?
Both are open-source and free solutions built to improve the monitoring of time-series data. On the one hand, Grafana is a leader in metrics visualization, while Prometheus is better for its metrics data collection and storage. Both tools can be combined into a robust monitoring solution suitable for monitoring all sorts of infrastructure and applications.