We may earn a commission if you make a purchase through the links on our website.
Kibana Beginner’s Guide

UPDATED: May 20, 2024
In this beginner’s guide to Kibana, we will go through the basics, features, pros and cons, and frequently asked questions about Kibana. We will also help get you started with Kibana. We will download, install, and configure it on a Windows Server.
But remember that the information you can find in this guide is just the tip of the iceberg. Kibana is quite a robust visualization and analytics tool. Although it can be easy to start, you’ll need to invest more time to design a proper solution for your specific use case and configure it correctly.
Table of Contents
- Introduction to Kibana
- Kibana’s Features
- Getting Started with Kibana
- Pros and Cons
- Kibana FAQ
1. Introduction to Kibana
a. What is Kibana?
Kibana is a free front-end application that lets you visualize, search, analyze, and manage log data indexed by Elasticsearch. Kibana sits on top of the popular Elastic Stack (former ELK Stack) formed by Elasticsearch, Beats, Logstash, and Kibana. The dashboard/UI front-end of the Elastic stack is used for monitoring, managing, and securing the entire Elastic cluster.
Kibana is popular for its visualization and dashboard generation. It lets users create line graphs, scatter plots, pie charts, heatmaps, and different diagrams and maps taken from large volumes of data. It also provides fantastic searching and querying capabilities to help users find what they are looking for.
b. Product Descriptions:
- Pricing Kibana is free when you self-host and self-manage it. You can also get Kibana through the Elastic Cloud— a public, fully managed service available on popular cloud providers. There are different pricing plans for Elastic Cloud; Standard ($95.00/month), Gold ($109.00/month), Platinum ($125.00/month), and Enterprise ($175.00/month).
- Trial You can try the officially hosted Elasticsearch Service on Elastic Cloud for free. Sign up for their 14-day free trial.
- Customer support Customer level depends on the plan you get. You’ll only get documentation and forum-level support for the self-hosted and self-managed Kibana. For commercial versions, you’ll get the former, plus phone-and web-based support.
- License Kibana and Elasticsearch have now changed their former open-source license (Apache 2.0) to a dual license under the Server Side Public License (SSPL) and Elastic License v2 (ELv2). Elastic’s code is still housed in public repositories and committed to open development and engagement with the community. However, although Kibana (and Elasticsearch) refer to their license as “source-available”, it is no longer open-source. Neither Elastic License nor SSPL are approved by the OSI (Open Source Initiative).
c. How does Kibana work?
As mentioned before, Kibana sits on top of the Elastic Stack— a platform designed to take data from any source (and format) and provide search, analytics, and visualization capabilities.
Being the front-end, Kibana provides the visualizations and management (through dashboards) of the logs indexed by Elasticsearch. Log data can be captured and transformed by Logstash (the bottom of the Stack). In addition, Beats also provides packages that can be configured to provide ready-made Kibana dashboards and visualizations.

2. Kibana’s Features
Below is a list of some of Kibana’s main features.
- Kibana Integrations Kibana allows many turn-key integrations, from alert-based (such as email, Slack-notifications, and PagerDuty workflows), different management, security, or monitoring (SIEM, APM, Uptime apps) to data ingestion from the cloud (AWS, Azure, GCP).
- Presentation tool Kibana provides Canvas— a data presentation and visualization tool that can get live data from Elasticsearch and present it with colors, images, or design elements. Canvas is a helpful tool for building real-time and highly visually appealing reports or infographics.
- Robust graphing With Kibana, you can create interactive charts, histograms, line graphs, heat maps, sunbursts, scatter plots, and all the basic graphs to represent vast volumes of data. You can also dynamically zoom (in/out), drag and drop fields, time windows, see previews, or inspect data in detail. Kibana also provides Kibana Lens, which gives smart suggestions that help you visualize data more effectively.
- Advanced Searching Kibana has advanced searching mechanisms that allow you to find what you are looking for across vast amounts of data. It will enable you to use field-level, free text, proximity, or logical statement searches.
- Explore location data Kibana comes with Elastic Maps, a feature that lets you analyze geospatial or location data. With this feature, you can visualize geographical information from your data and see it displayed on maps. It also allows you to create custom visualizations of layers and vector shapes.
- Detect hidden anomalies Kibana comes with ‘unsupervised’ Machine Learning (ML) capabilities that allow you to find anomalies hiding in your indexed Elasticsearch data. You can also analyze the properties of “root causes” that influence these anomalies.
- Sharing and collaborating Kibana comes with advanced sharing capabilities that allow you to ’securely’ share visualizations and dashboards. You can protect yourself from data leaks using an information restriction mechanism.
- Create alerts and automate actions Kibana allows you to generate alerts capable of detecting conditions using metrics-based thresholds. Once an alert is triggered, an action can take place using connectors. You can also integrate your Kibana alerts and get notifications with email, Jira, Microsoft Team, Slack, PagerDuty, ServiceNow, and more.
- Generate context-rich reports Create reports from dashboards or visualizations. You can generate reports instantly (on demand), schedule them for certain days of the week, or trigger report generation when conditions are met.
- Data searching and filtering Kibana comes with Discover— a data searching and filtering tool that lets you get the information you need and display its results through visualizations. This tool also enables you to save all your searches and position them on your dashboard.
3. Getting Started with Kibana
a. Kibana self-hosted vs. hosted solutions
You can run Kibana from self-hosted or fully-managed hosted solutions. The easiest way to start with Kibana is using their Elastic Cloud— an Elasticsearch-hosted service running on the cloud. With this paid service, you can use any Elastic product, including Kibana, from any supported cloud. The advantages of using the Kibana-hosted service include ease of deployment, security, scalability, cloud-enabled features, and reduced TCO.
Elastic Cloud is a paid service, with prices ranging from $95/per month to $175/per month. You can try Elastic Cloud for free by signing up for their 14-day free trial. Just feed data into the Kibana engine and start visualizing and exploring data.
The other way (more challenging but cost-efficient) to deploy Kibana is to self-host and self-manage the application. The advantages of using Self-managed Elastic services are an overall reduced cost, avoiding lock-ins, license adaptability, and flexibility.
b. Requirements for installing Kibana
As you might already know, Kibana runs on top of Elasticsearch (within the Elastic Stack). So, you’ll need to point Kibana to an existing Elasticsearch instance. It is always recommended to deploy Kibana on a separate node from your Elasticsearch node.
Note: Installing Elasticsearch is outside the scope of this guide.
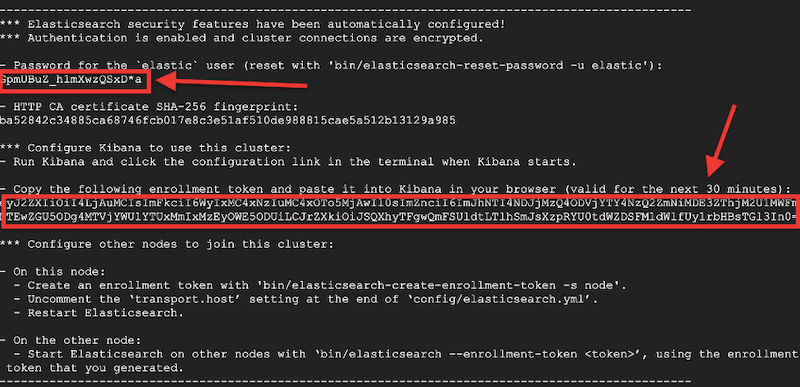
- When you start Elasticsearch for the first time, it will automatically configure the security parameters. It will set up certificates and keys for TLS, create a password for the Elastic user, and generate an enrollment token for Kibana. This is all the information you’ll need regarding security to start with the Elastic Stack.
- Although you should be able to start Kibana after a successful installation, you will need the enrollment token to be able to connect it with Elasticsearch. This enrollment token is valid for 30 minutes. If the token expires, you can generate a new one from the Elasticsearch installation.
- Below is an example of the Elasticsearch security feature’s configuration output. You’ll need to keep this information close and private.
b. Downloading and installing Kibana
Now that you have Elasticsearch ready, you can move on with Kibana.
You can install Kibana on various platforms, including Linux, macOS, Windows, Debian, RPM, or Docker images. When you download a Kibana installation package, it will include both free and subscription-based features. You can try all subscription-based features using a 30-day free trial.
NOTE: To illustrate the downloading and installation process, we will install Kibana on a Windows Server 2022.
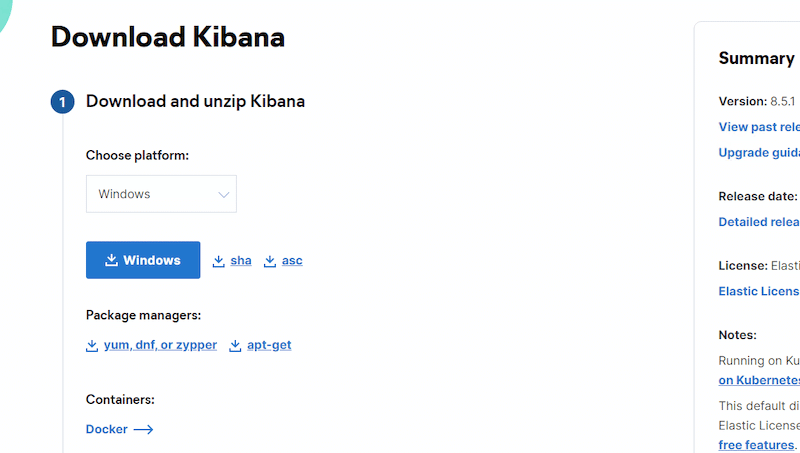
- Download the latest stable version of Kibana from its official website: www.elastic.co/downloads/kibana. Choose your platform, package manager, or Docker container and download it. We will download Kibana for Windows.
- Download and unzip the package. We downloaded the “kibana-8.5.1-windows-x86_64” package. The unzip process will take some time.
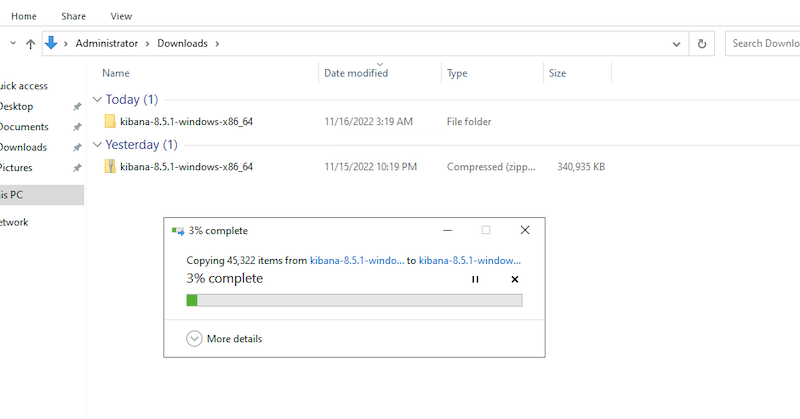
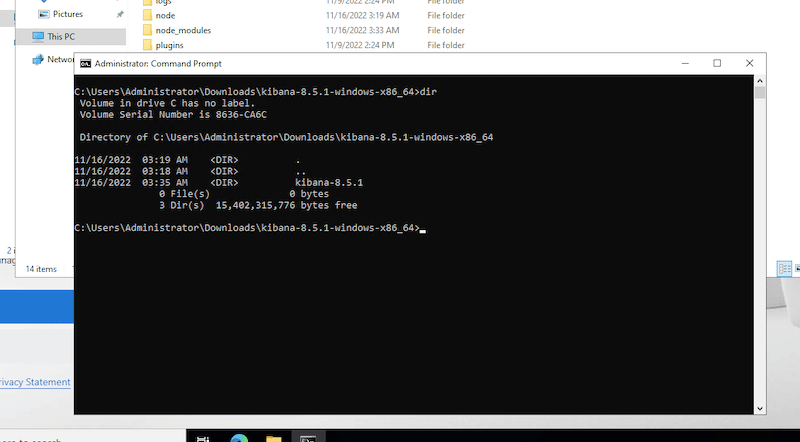
- Once you unzip the package, it will create a Kibana folder; for example, “kibana-8.5.1–windows-x86_64”. The path name to this folder can be referred to as the $KIBANA_HOME.
- Open the command prompt with the administrator’s privilege and change the directory to kibana-8.5.1–windows-x86_64.
- Start the Kibana installation by executing the batch (.bat) file from the command line. This batch file can be found on the $KIBANA_HOME > kibana-8.5.1 > bin.
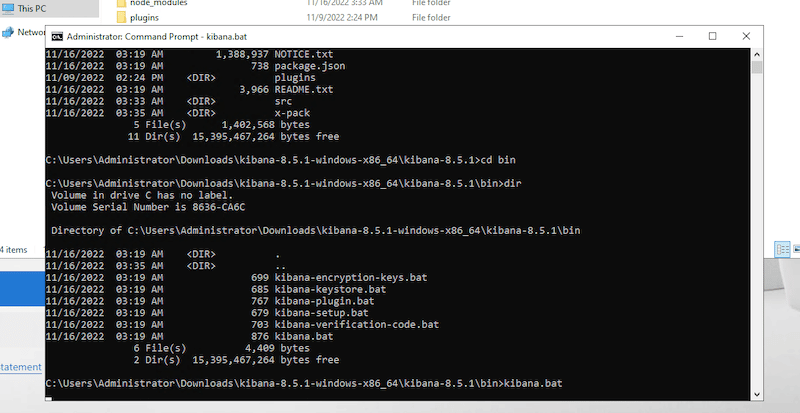
- Run the kibana.bat file. This batch will configure the Kibana process and start it. By default, once you run the script, Kibana will run in the terminal foreground and print its logs on the standard output. To stop it, you can press Ctrl+C.
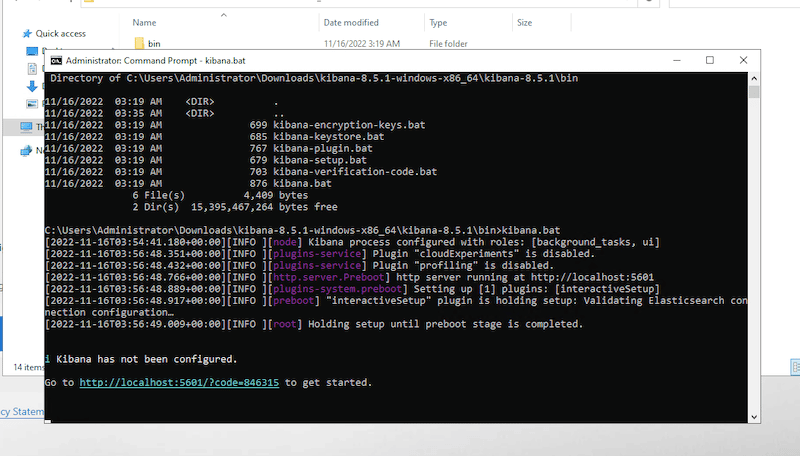
- The Kibana.bat file will also generate a link to open Kibana in your browser. For us, it generated the following unique link: “http://localhost:5601/?code=846315”. Although you could open Kibana with your unique link on your favorite web browser, you’ll not be able to use Kibana unless you register it with Elasticsearch.
c. Starting Kibana
As mentioned in the previous section, open your favorite web browser, and enter the unique link provided in the initial configuration. You’ll notice that Kibana will immediately ask you for an enrollment token to get started.
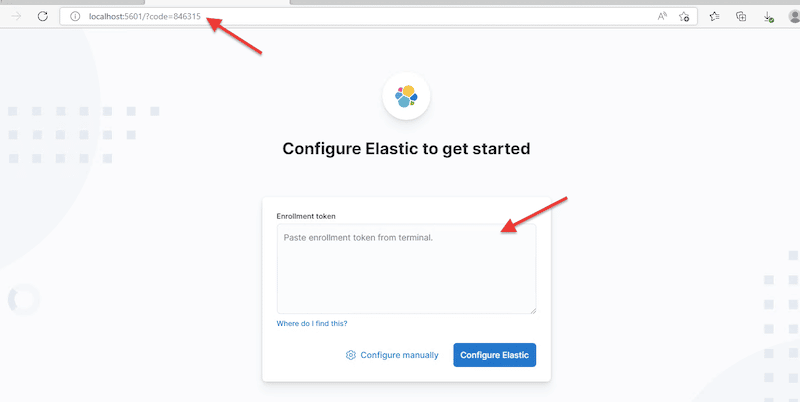
- How do you get the enrollment token? As mentioned in the requirements for installing the Kibana section, you will get this token and the Elastic user’s password from the initial Elasticsearch configuration. You could reset the password (with elasticsearch-reset-password tool) or get a new enrollment token (from elasticsearch-create-enrollment-token tool); both can be found in the Elasticsearch bin directory.
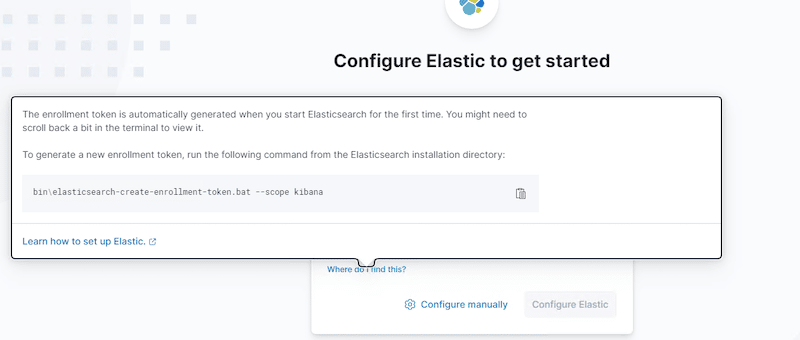
- Enter the enrollment token and click on “Configure Elastic”. Kibana will set up everything automatically and connect your instance to Elasticsearch through a secure TLS connection.
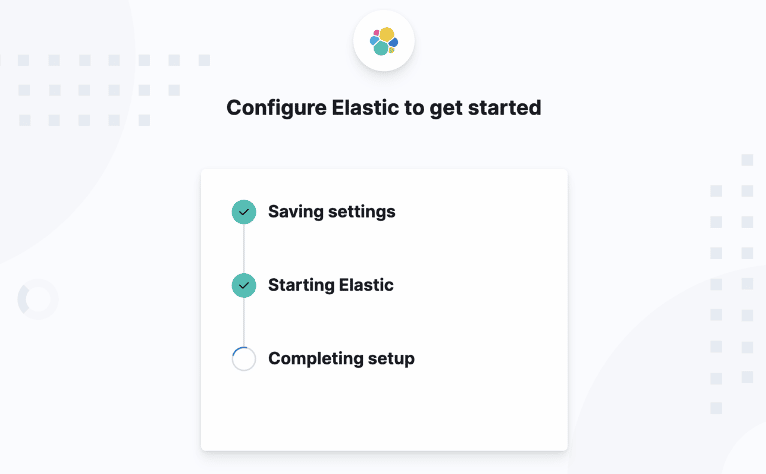
- Once the configuration is complete, you’ll be asked to enter the Elastic user password (which you got from the initial Elasticsearch configuration).
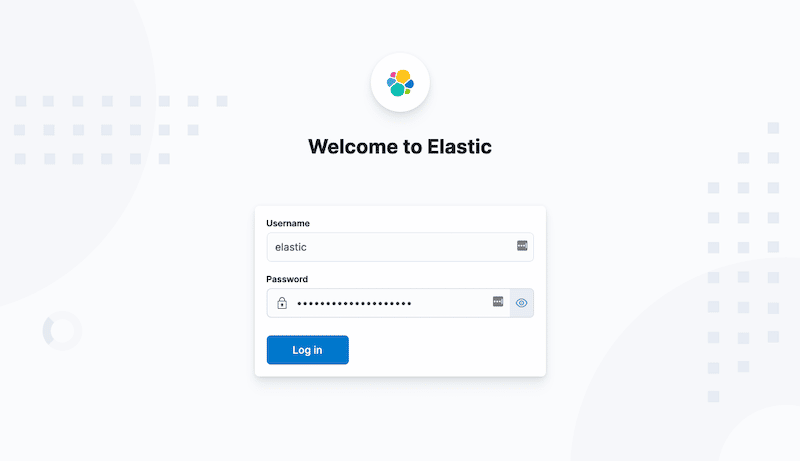
- Now, you are ready to start using Kibana.
d. Configuring Kibana
To change the general Kibana configuration, you’ll need to update the YAML-based kibana.yml file. The Kibana server uses this kibana.yml file to read the configuration on startup. The location of this file varies according to your OS. For our Windows deployment, the kibana.yml file is in $KIBANA_HOME/config.
- Open the YML file with your favorite text editor. For Windows, Notepad works fine.
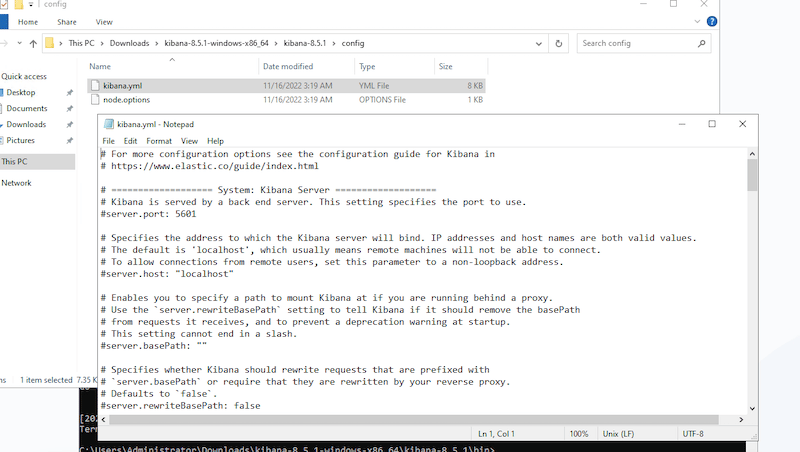
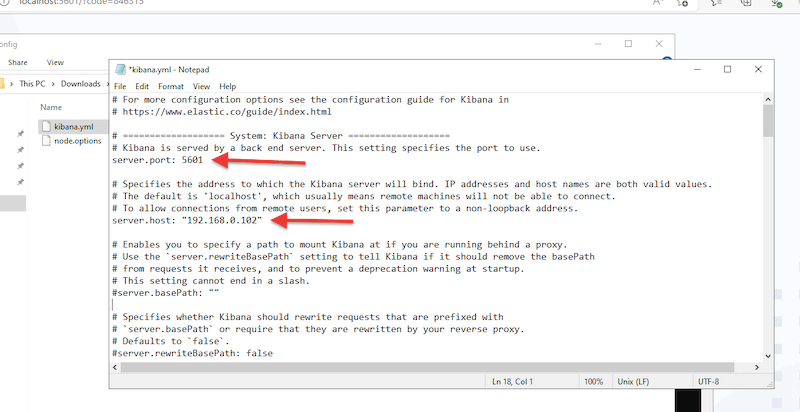
- As a configuration example, we’ll change some Kibana connection settings. By default, Kibana is configured to accept local connections; it comes with the host: “localhost” and server port: 5601 > (localhost:5601).
- To change this configuration and allow users to connect remotely, you’ll need to find the proper directives within the yml configuration, enable them (by removing the comments), and change them to your needs. For example:
- Another useful configuration is to ensure that the URL of the Elasticsearch host is set to the correct one. If the Elasticsearch host is not on the same machine as Kibana (localhost), then update this directive to the correct domain or IP followed by the port (i.e., http://elasticsearch:9200)
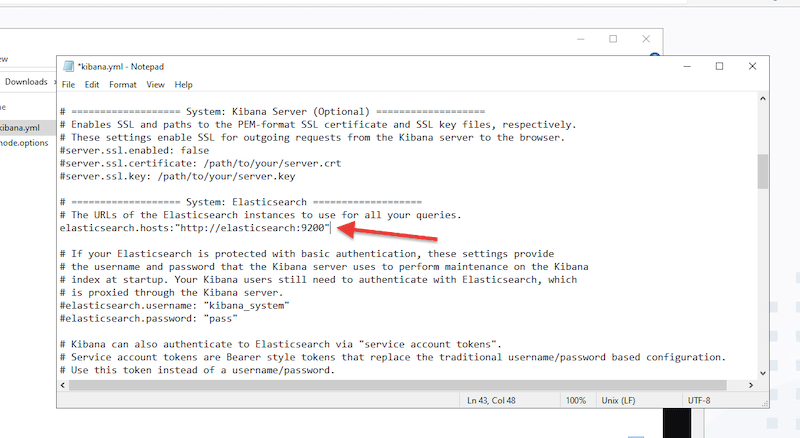
-
- Further, the (and complete) configuration of your Kibana server is outside the scope of this beginner’s guide. For more information on Kibana’s configuration directives, check Kibana’s official documentation.
e. Accessing and Using Kibana
So far, we have already installed and configured a few parameters of Kibana. We will now access Kibana’s UI and use it through the web browser. If you use Elastic’s hosted Elasticsearch Service (Elastic Cloud), you’ll also access Kibana through the web browser.
- To access Kibana, enter the IP address or domain along with the port where Kibana is deployed.
- If you are attempting to access Kibana remotely, set the “server-host” directive (as we did in the previous section) to an address other than “localhost:5601,” for example, “192.168.0.102:5601” or “yourdomain:5601”
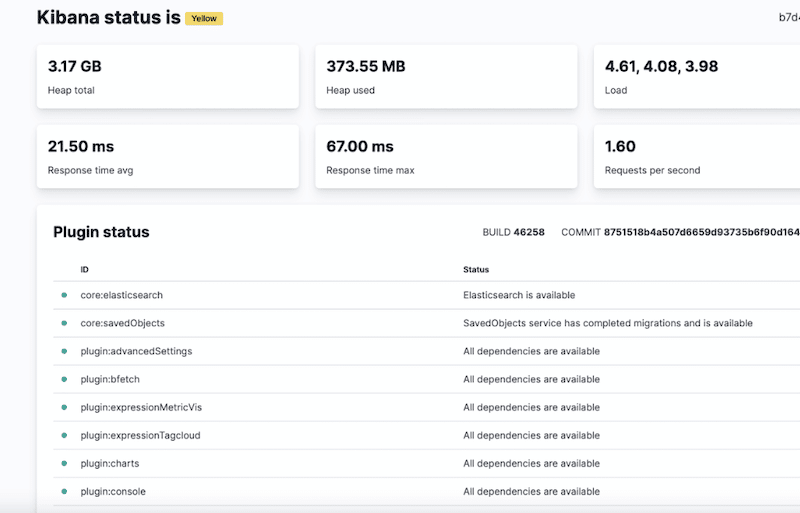
- Enter your Elastic credentials, go to the homepage and click Kibana. If you are already receiving log data from your Elastic stack, you should be able to see information being displayed on the Kibana Status page (localhost:5601/status).
d. Troubleshooting: Kibana server is not ready yet
If you can install and open Kibana successfully, but you still receive the error: “Kibana server is not ready yet,” and you can't see any further information, you'll need to check a few logs and perform some tests. You are getting this error because either: the Elasticsearch service is down (or inactive), incorrect Elasticsearch host configuration, or an incompatibility between Elasticsearch and Kibana.
- Check the Elasticsearch connectivity Use any networking utility such as ‘ping’ or ‘traceroute’ to troubleshoot any connectivity issue.
- Check the Kibana Logs For Windows, you can find them on $KIBANA_HOME\log\kibana.log. For Linux (DEB or RPM) packages, check on /var/log/kibana/kibana.log.
- Check the Elasticsearch logs The location of the Elasticsearch logs varies from OS to OS. For Windows, you can find logs in %ES_HOME%\logs.
4. Pros and Cons of Kibana
Below is a list of the most popular pros and cons of using Kibana. Why would you need to use it? Or why would you need to consider using an alternative?
Pros:
- Kibana integrations: One of the main reasons you need to use Kibana is because of its integrations. The Elastic stack allows you to use various data ingestion methods, from cloud infrastructure, applications, security, databases, content repositories, etc. Once the data (generated by other monitoring tools) is in Elasticsearch, you’ll be able to visualize in Kibana.
- Great dashboards and visualizations: Kibana is pretty famous for its dashboards and visualizations. They give you an overview of what’s going on in your applications and infrastructure. With the right Kibana implementation, you will likely end up with a single-pane-of-glass showing all your systems and apps in production.
- Real-time Observability: Kibana is a fantastic addition to any observability strategy. It monitors and provides insights from logs generated from large numbers of systems. It can also be used to debug events in real-time and generate visually-stunning visualizations. Kibana will help admins analyze and find the root cause of problems.
- Powerful searching and filtering: Kibana comes with a robust index that allows quick and filtered searches. You can search across large sets of data with advanced queries and filters. You can also search by clicking on different elements within a visualization.
Cons:
- Its new license model: Elastic changed its former open-source license into a dual license, which is not yet approved by the OSI (Open Source Initiative). The move from open to ‘close' is already stopping deployments that rely on official package repositories. Plus, Elastic users are now moving to forked open-source projects. The license changes, for instance, made Amazon AWS develop the OpenSearch project— a forked project entirely based on the older (open-source) Apache-licensed versions of Elasticsearch and Kibana. This project was created to serve the former Amazon Elasticsearch Service (now Amazon OpenSearch Service). Amazon’s OpenSearch Service will not deliver today’s (or future) versions of Elasticsearch and Kibana.
- Initial deployment can be challenging: Deploying a self-managed Elasticsearch and Kibana stack can take time and effort initially. You'll need to invest some time learning how to install it, especially for production environments.
- Scalability and performance: If the initial deployment is not properly architected, its performance will likely be slow, and its operation will be complex. In addition, Kibana is also known to have some performance issues when working with large datasets.
Kibana FAQs
What is Kibana used for?
Kibana is used to visualize Elasticsearch data and go through the entire Elastic Stack. You can use Kibana for log and time-series data analytics, application monitoring, and operational and business intelligence. With Kibana, you can do anything, from keeping track of the query load to knowing how requests flow through applications.
How to use Kibana?
To use Kibana, you’ll need to connect and enroll it with Elasticsearch and configure it to create visualizations. You can use Kibana through its web browser UI.
What are the differences between Elasticsearch vs. Kibana?
Both applications belong to the Elastic Stack. Elasticsearch is a search and analytics engine, while Kibana provides the charts and graphs visualizations in Elasticsearch.
What are the differences: between Logstash vs. Kibana?
Logstash is a data processing pipeline that takes data simultaneously and from multiple sources. It then transforms and sends this data to a store “or stash” platform such as Elasticsearch. Kibana provides the visualizations and dashboards of this data.
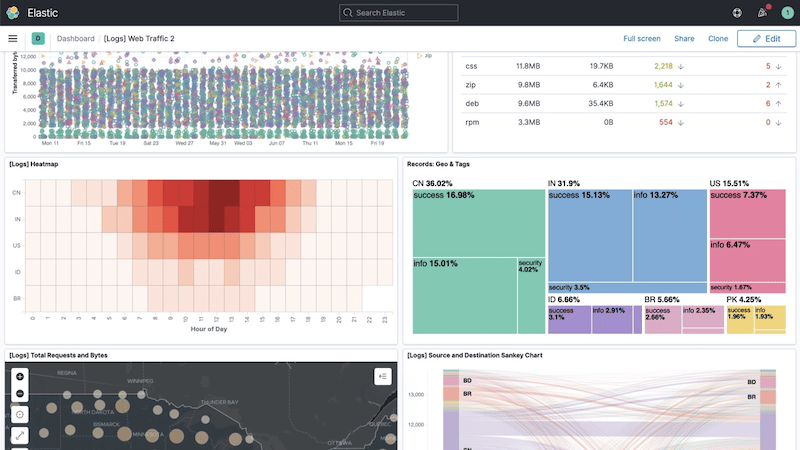
What is the Kibana dashboard?
The Kibana dashboard displays information about your monitored applications. It is mainly a collection of graphs, metrics, filters, charts, maps, and searches that are combined into a single-pane-of-glass. A Kibana dashboard gives you the entire picture of the Elasticsearch data.
Are Kibana and Elasticsearch closed source?
In May 2021, Elastic discontinued its open-source project and introduced a “source-available dual-license” under the SSPL and Elasticsearch License. Elastic is now, in reality, a proprietary license.
Kibana vs. Grafana?
Grafana is a fantastic visualization and dashboard tool. It relies on tools like Prometheus as the data source for time-series data and can produce unique and visually appealing visualizations. Kibana, on the other hand, comes with visualization and searching capabilities and runs on top of the Elastic Stack. Kibana is mainly used for analyzing application logs.