We may earn a commission if you make a purchase through the links on our website.
The Best MySQL Monitoring Tools
UPDATED: January 29, 2025
MySQL is the second most popular relational database management system (RDBMS) after Oracle. It is endearing facts like being a free and open-source database platform – while still offering advanced data management features and a robustness few others can match – that have contributed to its being favored as such.
This popularity also means there will always be a market for MySQL monitoring tools that database administrators (DBAs) can use to get the maximum performance out of their databases.
Here is a summary list of the best MySQL monitoring tools:
- Idera SQL Diagnostic Manager for MySQL – EDITOR'S CHOICE Package of database monitoring analysis that includes optimization for MySQL queries and the databases that they run on. Available for Windows, Windows Server, and Linux. Access a 14-day free trial.
- Paessler PRTG MySQL Monitoring – FREE TRIAL Cloud-based network infrastructure monitoring tool that uses numerous sensors to help administer MySQL databases as well as the hardware and software solutions that support them. Access a 30-day free trial.
- Datadog Infrastructure – FREE TRIAL This cloud-based system monitoring platform offers application monitoring for services that include databases, such as MySQL instances. Get a 14-day free trial.
- Site24x7 – FREE TRIAL Excels in MySQL monitoring, offering a specialized solution that ensures database administrators can maintain optimal performance and reliability of MySQL databases. Its in-depth monitoring capabilities, combined with customizable alerts, comprehensive reporting, and integration with wider IT infrastructure monitoring, make it an ideal choice for complex systems where MySQL is a critical component. Start a 30-day free trial.
- ManageEngine Application Manager Popular suite of software and hardware monitoring tools for enterprise database solutions like Oracle, MS SQL, and MySQL which makes it a great choice for businesses with hybrid data storage systems.
- SolarWinds Server & Application Monitor Monitoring system tracks issues with more than 1,200 applications, including MySQL and other DBMSs. Link server capacity to application performance issues and get alerts to spot growing problems with this on-premises package for Windows Server.
- Percona Monitoring and Management Tool Free and open-sourced database monitoring, management, and security solution for all flavors of MySQL.
- AppDynamics MySQL Performance Monitoring Comprehensive database monitoring tool that works round-the-clock and gives in-depth insights into their performances as well as dependable forecasts.
What are the main metrics MySQL monitoring tools keep track of?
A good MySQL monitoring tool reads the pulse of a MySQL database and server system by tracking four main metrics:
- Queries: it is important to keep an eye on the performance of every single query to ensure there is an optimal performance in execution time. On the other hand, databases need to be monitored for inefficient connections between tables, insufficient indexes, and unnecessarily complex SQL statements which should trigger alerts.
- Capacity Issues: database performance can be affected by issues with the hardware it sits on like low processing power, slow hard disk read-write times, hardware misconfiguration, low disk space, and low memory.
- Conflicts among users: when there are many users on a database they could run queries that interfere with one another's activities. If one user's database query takes too long, it could cause a page or row lock. Transactional locks or deadlocks could also keep other users out until they are released. These tools help identify such conflicts.
- Configuration issues: improper hard disk configurations can cause issues. To avoid such performance issues, a tool can monitor for issues like insufficient buffer sizes or the absence of a query cache.
Armed with input from monitoring tools, a DBA can quickly resolve issues and get things back on track.
The best MySQL monitoring tools
Our methodology for selecting MySQL monitoring tools
We reviewed the market for MySQL monitoring software and analyzed the options based on the following criteria:
- Extract transaction data from MySQL
- Assess My SQL objects for efficiency
- Identify the cause of performance problems
- Correlate server resource usage with database activity
- Recommendations for performance improvements
- Free trial or a demo of the system to allow an assessment before buying
- Value for money from a database monitor that also provides system and dependant application monitoring
1. Idera SQL Diagnostic Manager for MySQL – FREE TRIAL
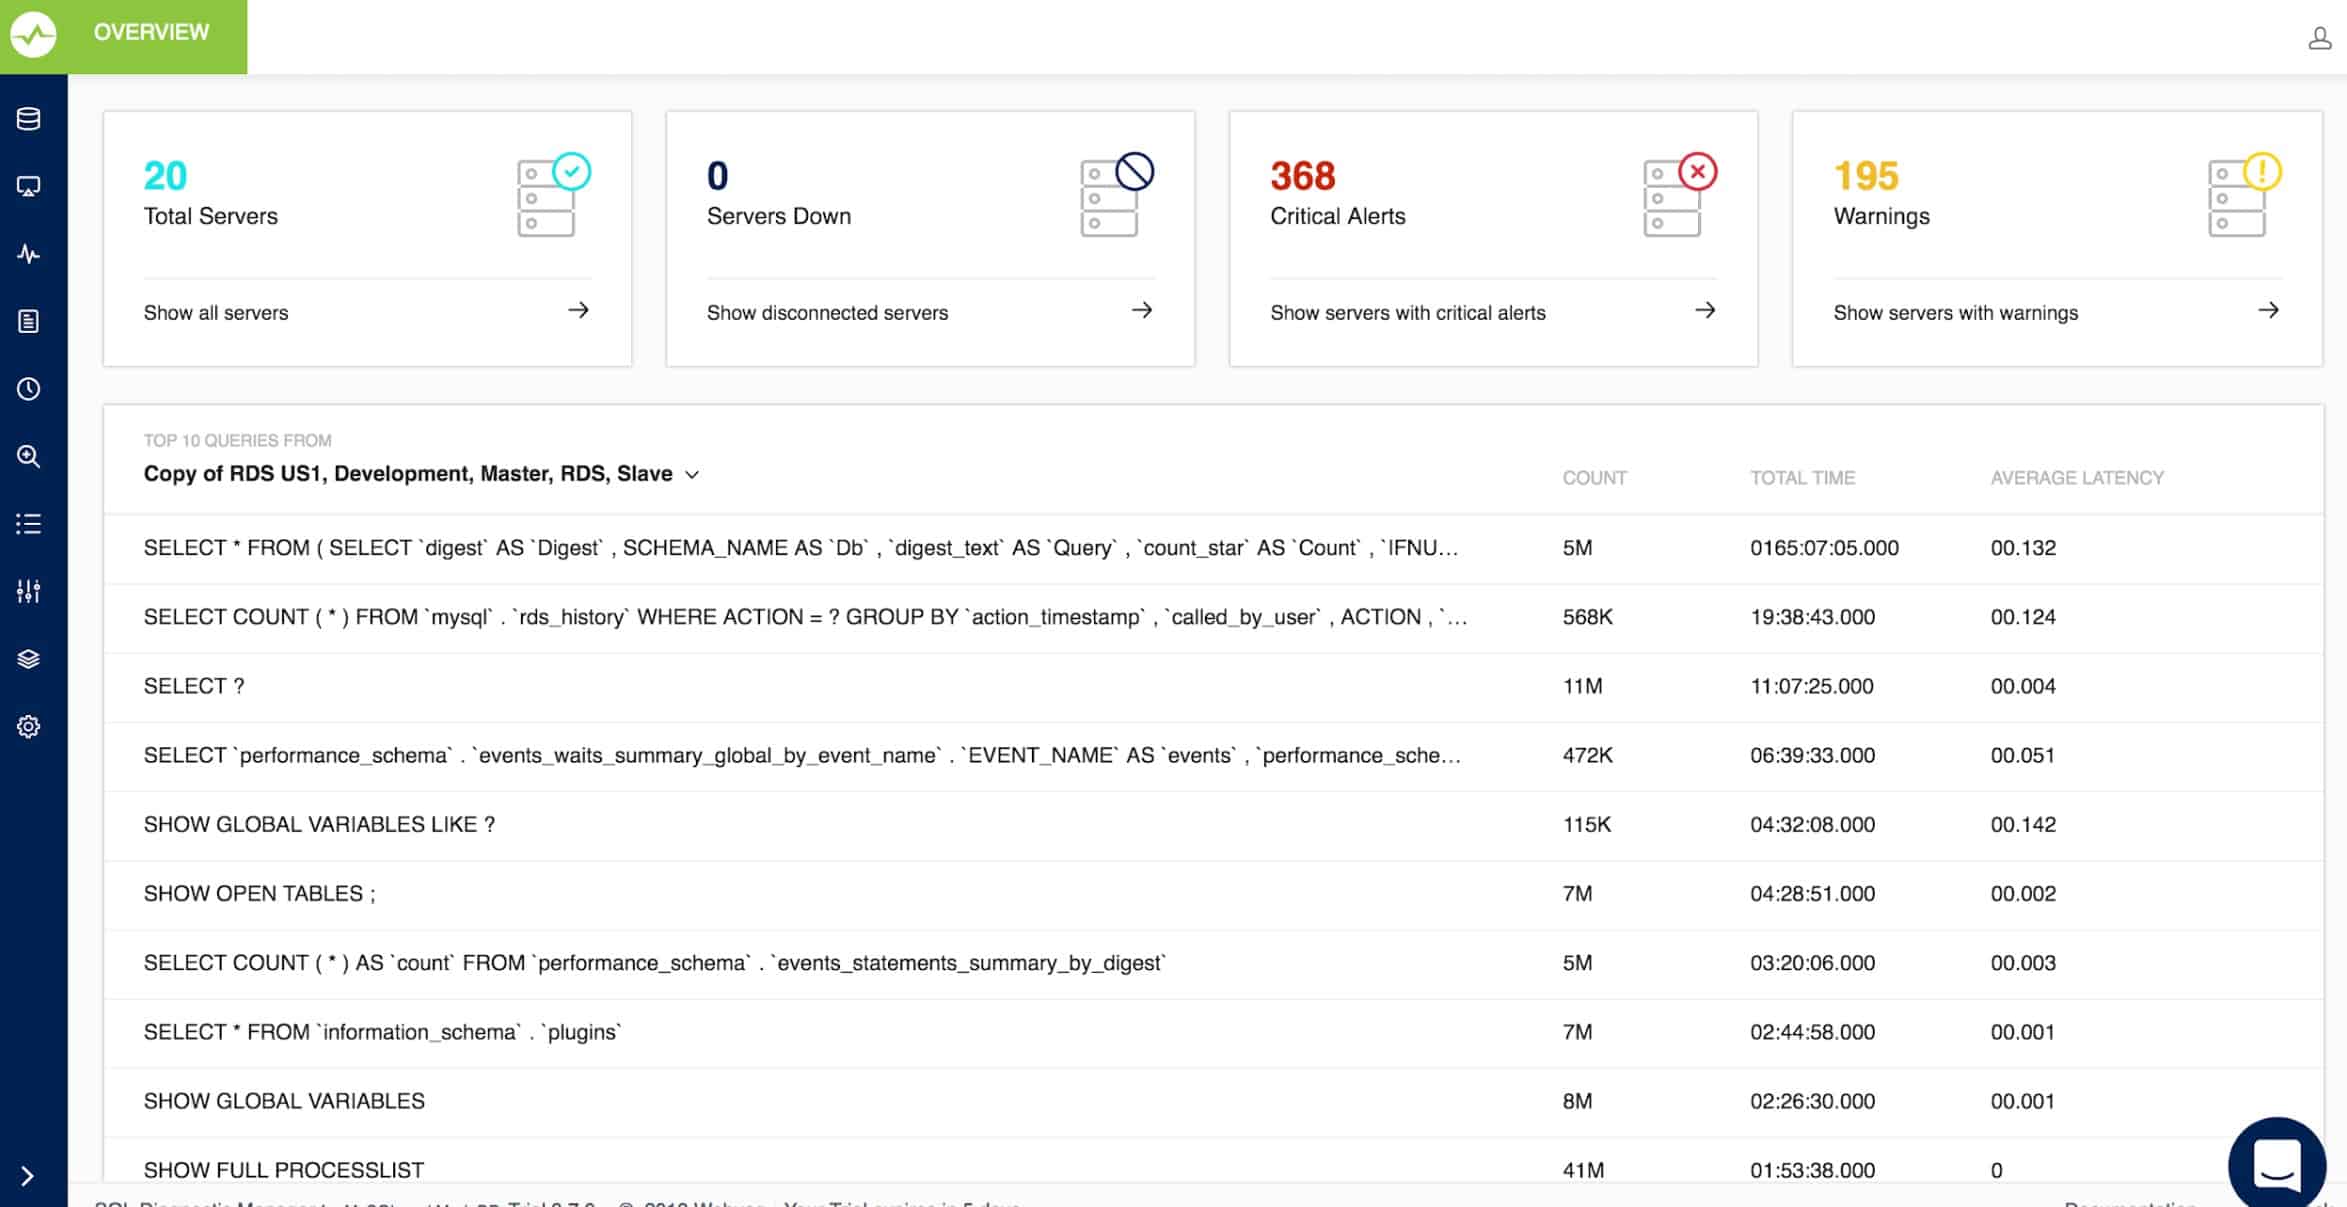
Idera SQL Diagnostic Manager for MySQL is a package of monitoring and management tools for databases created in the MySQL DBMS. It is also able to monitor other DBMSs and there is a different version of the package that caters to SQL Server databases.
Key Features:
- Comprehensive Monitoring: Monitors MySQL databases, MariaDB, Aurora, Azure Database for MySQL, Amazon RDS, Google Cloud SQL for MySQL, and Oracle Cloud MySQL Cloud Service DBMSs, providing extensive support for various database environments.
- Live Monitoring: Offers live monitoring for databases with graphical representations of resource usage, enabling real-time monitoring and performance analysis.
- Performance Optimizer for Queries: Provides a performance optimizer for queries, showing the interaction of each transaction with database objects and enabling the improvement of database structures.
- Automated System Process Tracking: Tracks and records automated system processes such as backup and replication, ensuring comprehensive monitoring and management of database operations.
- Log Manager: Includes a log manager that stores all log files produced by the monitored databases, facilitating log analysis and troubleshooting.
- Cross-Platform Support: Available for Windows, Windows Server, and Linux environments, providing flexibility and compatibility across different operating systems.
Why do we recommend it?
Idera SQL Diagnostic Manager for MySQL offers a comprehensive package of monitoring and management tools tailored for MySQL databases, making it an ideal solution for database administrators (DBAs) seeking efficient database monitoring and performance optimization capabilities. Our recommendation is based on the platform's extensive support for various DBMSs, live monitoring features, performance optimizer for queries, and comprehensive tracking of automated system processes. With its simple yet powerful interface and support for collaboration features, SQL Diagnostic Manager for MySQL provides DBAs with the tools they need to effectively manage MySQL databases.
Who is it recommended for?
Idera SQL Diagnostic Manager for MySQL is recommended for database administrators (DBAs) and organizations managing MySQL databases, including MySQL, MariaDB, Aurora, Azure Database for MySQL, Amazon RDS, Google Cloud SQL for MySQL, and Oracle Cloud MySQL Cloud Service DBMS. It caters to DBAs seeking a user-friendly monitoring solution with live monitoring capabilities, performance optimization tools, and comprehensive log management features. Additionally, SQL Diagnostic Manager for MySQL is ideal for organizations requiring support for Windows, Windows Server, and Linux environments.
Pros:
- Simple but Powerful Interface: Makes it ideal for new users and facilitating efficient database monitoring and management.
- Auto Formatting and Syntax Color: Helps DBAs stay organized when managing databases at scale.
- Presets and Recommendations: Improves performance out of the box, streamlining performance optimization tasks.
- Collaboration Features: Real-time feedback and team features, enhancing collaboration among DBAs and teams.
Cons:
- Short trial period: The trial period could be longer, potentially limiting the time for users to fully evaluate the product and its capabilities.
Idera offers a 14-day free trial of SQL Diagnostic Manager for MySQL.
EDITOR'S CHOICE
Idera SQL Diagnostic Manager for MySQL is our top pick for a MySQL monitoring tool because this on-premises package provides both database instance performance monitoring and query optimization analysis. The analytical tools in the package compare query joins to the indexes and views in the database. It will indicate which queries are not hitting the indexes and then highlight how either the queries or the database structures can be improved in order to speed up query responses. The ongoing database monitoring service tracks demand on each MySQL database instance and notes its capacity, resource usage, and response times. The system looks for long-running queries and other activity indicators such as CPU and memory usage and I/O transactions. Idera also offers a similar package for monitoring SQL Server databases. Although this is an on-premises package, it is also able to monitor MySLQ databases that are hosted on cloud platforms.
Download: Get a 14-day free trial
Official Site: idera.com/productssolutions/sql-diagnostic-manager-for-mysql
OS: Windows, Windows Server, and Linux
2. Paessler MySQL Monitoring – FREE TRIAL
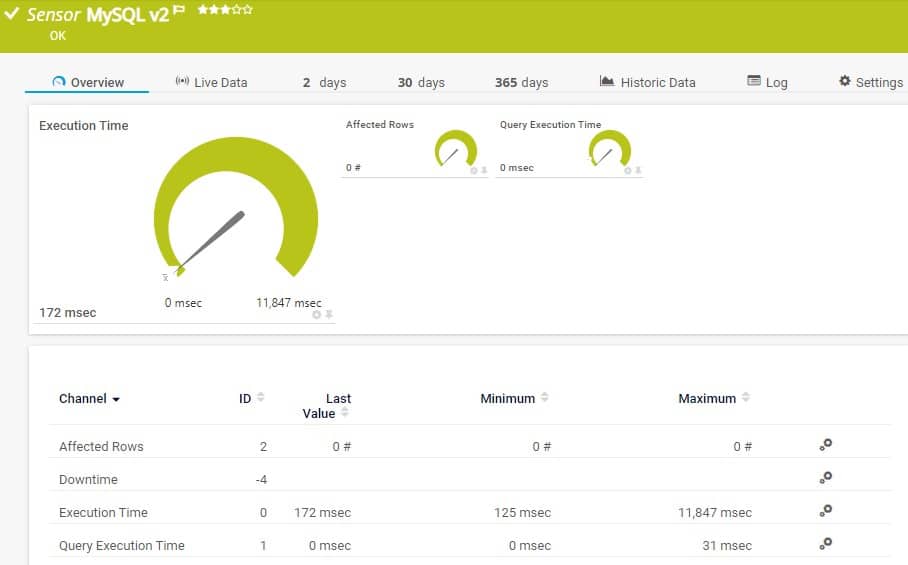
Paessler PRTG, a cloud-hosted network and infrastructure monitoring tool – offers predefined sensors for every important database manufacturer, including MySQL, with the help of its MySQL v2 Sensor.
Key Features:
- Support for Multiple Database Manufacturers: Monitors Oracle, PostgreSQL, Microsoft SQL Server, and MySQL databases, catering to organizations with diverse database infrastructures.
- Flexible and Customizable Dashboard: Tabs for quick access to notifications, alarms, and logs, facilitating easy monitoring and issue management.
- Ease of Setup: Default, pre-configured sensors or custom configuration options for unique scenarios, reducing deployment time and effort.
- Real-Time Monitoring: Execution times of queries, transaction handling, and latency optimization, enabling proactive issue detection and troubleshooting.
- Autodiscovery: Reflects the latest inventory changes almost instantaneously, ensuring up-to-date monitoring of database environments.
Why do we recommend it?
Paessler PRTG offers comprehensive MySQL monitoring capabilities within its cloud-hosted network and infrastructure monitoring tool. With predefined sensors for MySQL, including the MySQL v2 Sensor, PRTG simplifies the monitoring process for database administrators and IT professionals. Its flexible and customizable dashboard, ease of setup, and real-time monitoring features make it an ideal choice for organizations with complex database environments.
Who is it recommended for?
PRTG is recommended for database administrators and IT professionals managing MySQL databases, particularly in complex database environments where multiple database manufacturers are present. Its support for Oracle, PostgreSQL, Microsoft SQL Server, and MySQL makes it suitable for organizations with diverse database infrastructures. Additionally, PRTG's freeware version and flexibility in sensor customization make it accessible to organizations of all sizes.
Pros:
- Part of a Larger Suite of Application-Specific Monitors: Monitors multiple services and servers within the organization.
- Freeware Version: Accessible to organizations with budget constraints or smaller-scale monitoring needs.
- Flexibility and Sensor Customization: Tailors monitoring to specific requirements.
Cons:
- Complex Platform with Many Features: May require time to learn and fully utilize, particularly for users new to the platform.
PRTG offers a free download of their unlimited version of the tool that is free to use for up to 100 sensors. You can trial the full version free for 30 days.
3. Datadog Infrastructure – FREE TRIAL
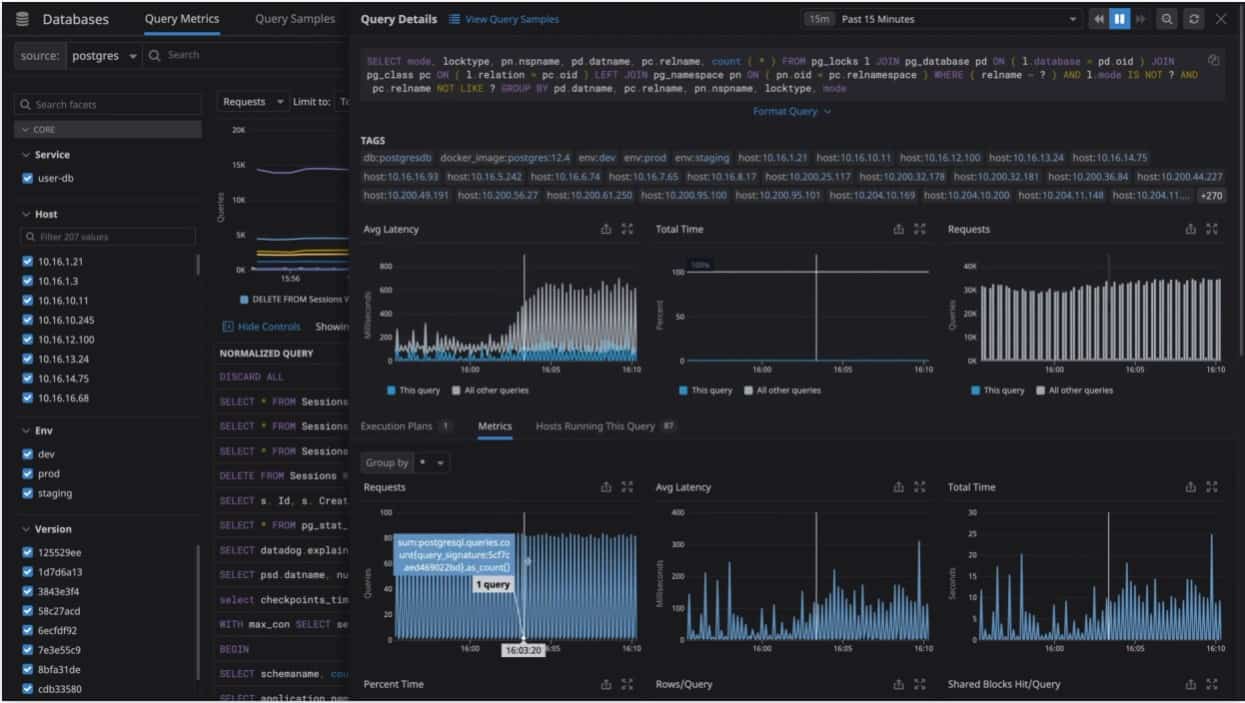
Datadog Infrastructure is a cloud-based service that covers services and applications. The package’s remit includes the monitoring of databases, including those run by MySQL. This system can monitor database instances anywhere, including on cloud platforms.
Key Features:
- Customizable Screens: Cloud-resident console accessible from any standard web browser, providing flexibility in monitoring and visualization.
- Application Dependency Tracking: Tracks application dependencies to show databases in context with the systems that use them and those that support them, enabling comprehensive monitoring of application environments.
- Database and Query Analyzer: Supports query optimization and suggesting new structures to improve performance, enhancing database optimization efforts.
- Server Resource Monitoring: Provides a view of server resources supporting databases, enabling monitoring of resource utilization and performance.
- Alert Notifications: Sends alerts on performance and resource availability via email, Slack, PagerDuty, Jira, and Webhooks notifications, ensuring timely notification of critical issues.
Why do we recommend it?
Datadog Infrastructure is a comprehensive cloud-based service designed for monitoring services and applications, including databases such as MySQL. Our recommendation is based on the platform's extensive monitoring capabilities, customizable screens, and database and query analyzer, which enable efficient monitoring and optimization of MySQL databases. With features like application dependency tracking, server resource monitoring, and alert notifications, Datadog Infrastructure provides organizations with a powerful solution for monitoring databases in any environment.
Who is it recommended for?
Datadog Infrastructure is recommended for organizations of all sizes requiring comprehensive monitoring capabilities for services and applications, particularly those utilizing MySQL databases. It caters to businesses seeking a cloud-based SaaS product with customizable dashboards, flexible pricing options, and specific agents and dashboards for MySQL monitoring. Additionally, Datadog Infrastructure is ideal for organizations needing scalable monitoring solutions with support for email, Slack, PagerDuty, Jira, and Webhooks notifications.
Pros:
- Easy-to-Use Customizable Dashboards: Features easy-to-use customizable dashboards, allowing users to tailor monitoring screens to their specific needs and preferences.
- Cloud-Based SaaS product: No server deployments or onboarding costs, providing hassle-free monitoring solutions for organizations.
- Specific Agents and Dashboards for MySQL Monitoring: Ensures comprehensive monitoring and optimization of MySQL databases.
- Flexible Pricing Options: Allows businesses to scale their monitoring efforts reliably through flexible pricing options, accommodating organizations of all sizes and budgets.
Cons:
- Short Trial Period: Could be longer for comprehensive testing and evaluation, potentially limiting the time for users to fully explore the product's capabilities.
Datadog Infrastructure is a subscription service that is available in three editions: Free, Pro, and Enterprise. The Free edition is limited to monitoring five hosts. The Enterprise edition is higher than the Pro version because it adds on AI-based machine learning to identify application dependencies and predict resource exhaustion. Datadog Infrastructure is offered on a 14-day free trial.
4. Site24x7 – FREE TRIAL
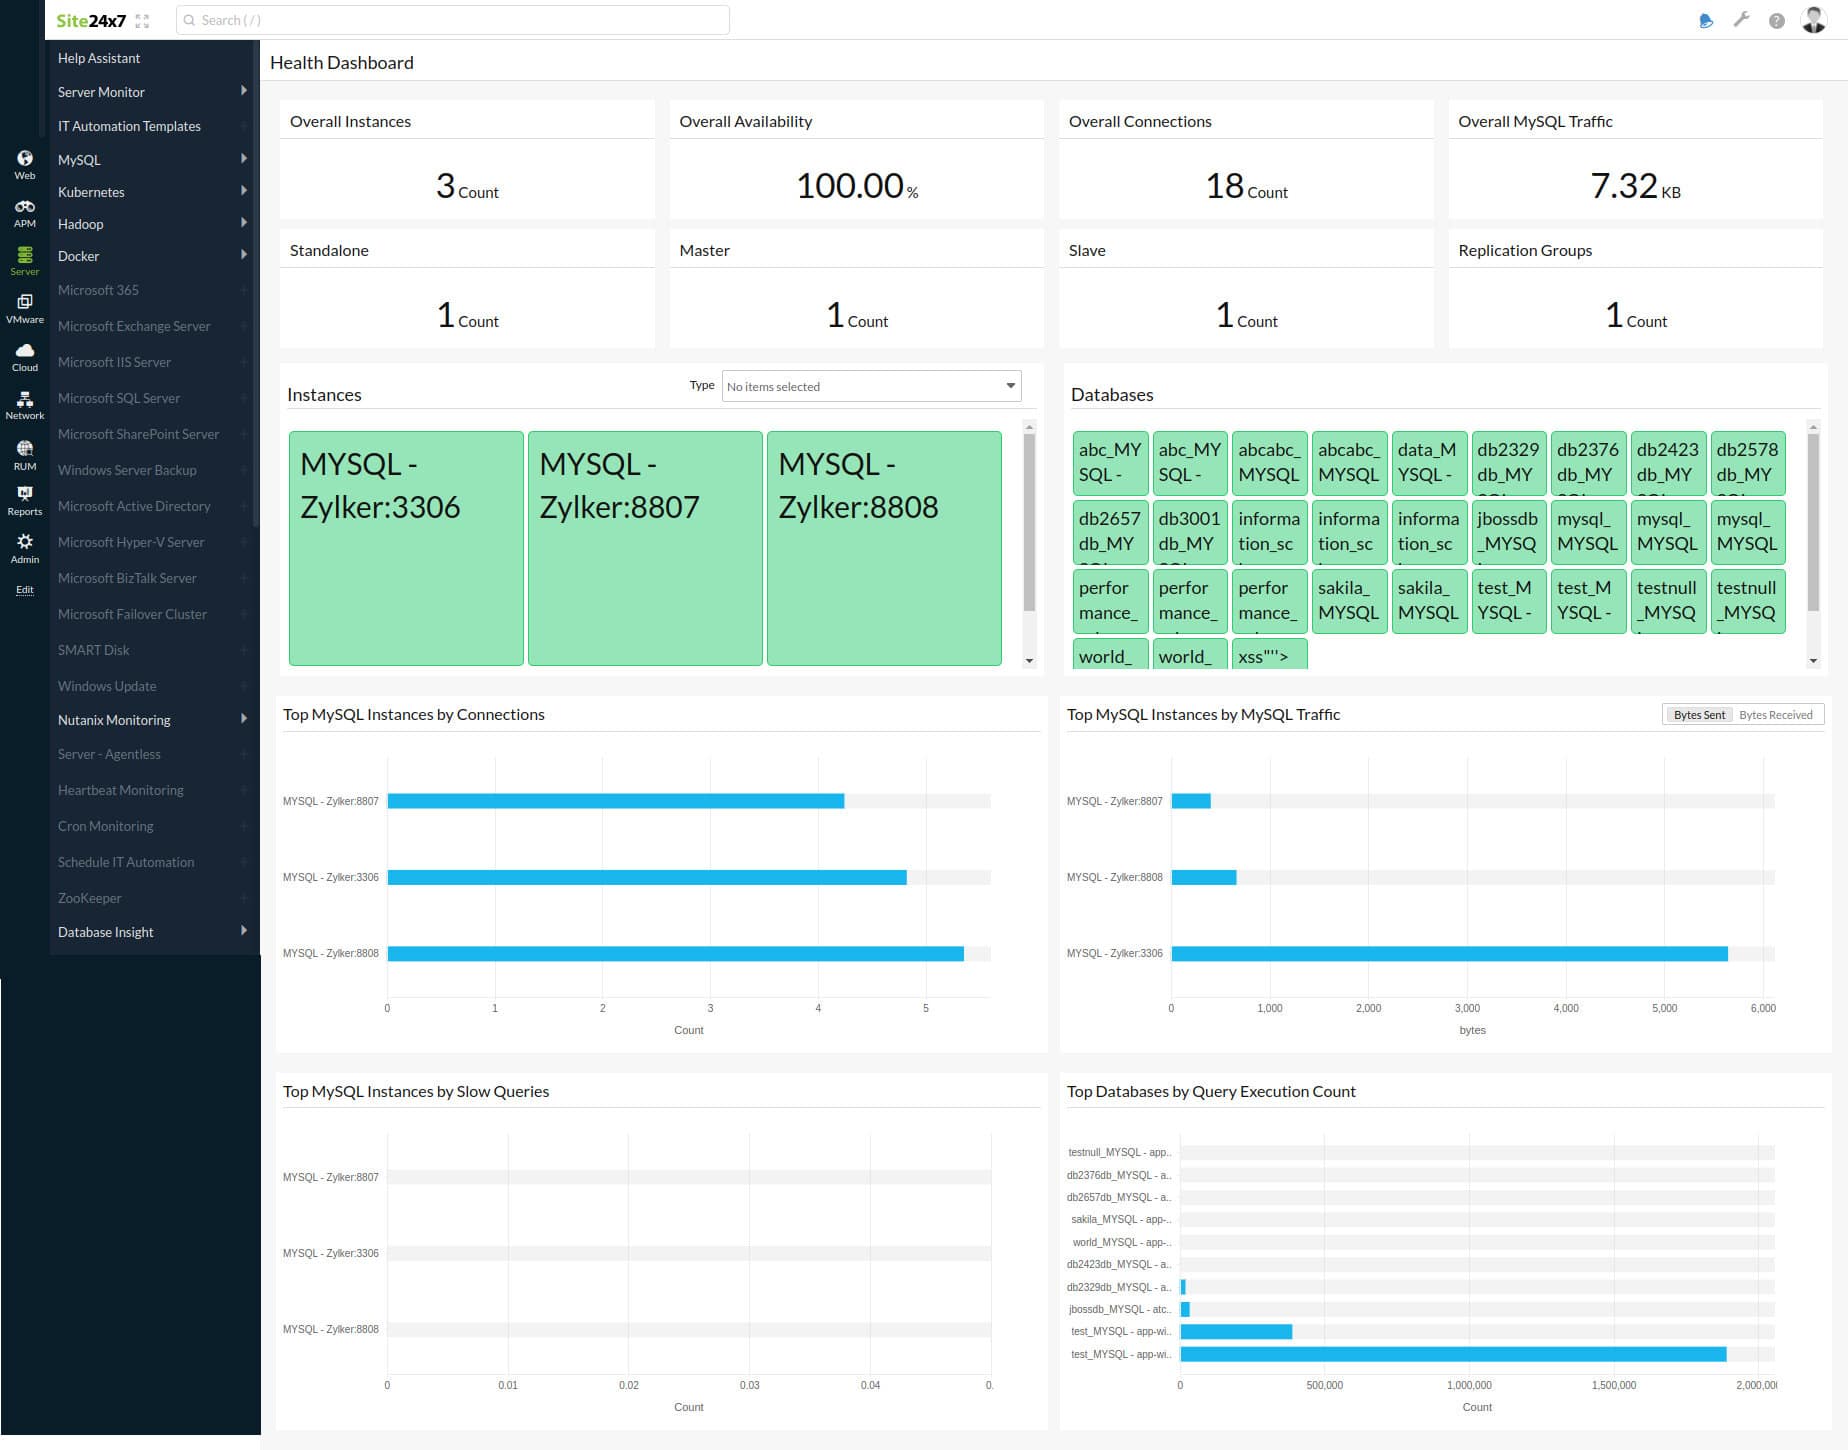
When it comes to MySQL monitoring, Site24x7 offers a comprehensive solution that stands out among the best tools available. It provides in-depth monitoring capabilities tailored specifically for MySQL databases, ensuring that database administrators and IT professionals can maintain optimal performance and reliability. Site24x7’s ability to monitor MySQL in conjunction with a full spectrum of IT infrastructure components makes it an excellent choice in scenarios where MySQL is a part of a larger, more complex system.
Key Features:
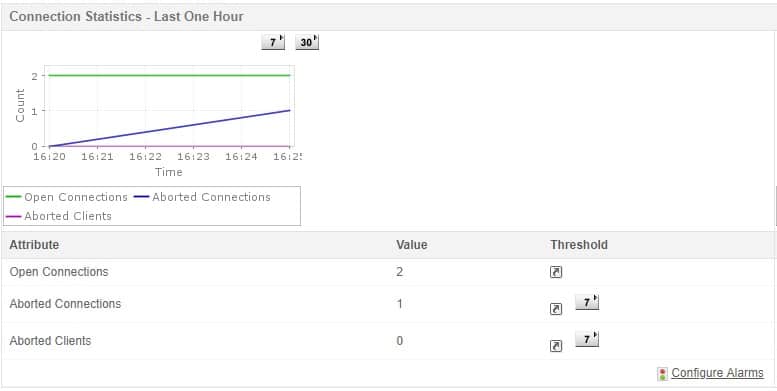
- Detailed MySQL Performance Metrics: Includes query analysis, connection stats, and buffer pool usage, enabling thorough monitoring of MySQL databases.
- Customizable Alerting System: Immediate notifications of database issues, ensuring timely response to potential performance or reliability issues.
- Comprehensive Reporting and Dashboard Tools: Easy visualization of MySQL health and performance, facilitating efficient monitoring and analysis.
- Automated Discovery and Monitoring: Simplifies setup and ensuring comprehensive coverage of database instances.
- Integration with Other IT Infrastructure Monitoring: Holistic view of system health, enabling organizations to monitor MySQL databases within the context of their entire IT environment.
Why do we recommend it?
Site24x7 offers a comprehensive MySQL monitoring solution with detailed performance metrics and a robust alerting system, making it an ideal choice for database administrators and IT professionals. Its ability to provide deep insights into MySQL health and performance, coupled with comprehensive reporting and dashboard tools, ensures optimal performance and reliability of MySQL databases within larger IT infrastructures. We recommend Site24x7 for its tailored MySQL monitoring capabilities and its ability to integrate seamlessly with other IT infrastructure monitoring tools.
Who is it recommended for?
Site24x7 is recommended for IT professionals and database administrators managing MySQL databases, particularly in environments where MySQL is part of a broader IT infrastructure. Its detailed performance monitoring capabilities make it suitable for medium to large enterprises requiring a comprehensive overview of their database systems. While Site24x7 may be more complex for smaller or simpler MySQL setups, its robust features and customization options cater to the needs of organizations with complex IT infrastructures.
Pros:
- In-Depth MySQL Performance Monitoring: Provides valuable insights into database health and performance.
- Robust Alerting and Notification System: Ensures timely detection and response to database issues.
- Comprehensive Reporting and Dashboard Capabilities: Easy visualization and analysis of MySQL health and performance.
Cons:
- Potentially Unnecessarily Complex: Despite offering robust features and customization options, may be more complex than necessary for smaller or simpler MySQL setups, potentially requiring additional configuration and management effort.
5. ManageEngine Applications Manager
ManageEngine Applications Manager is another suite of software and hardware monitoring tools that holds a large share of the market. This tool has the ability to manage JDBC databases like Oracle, MS SQL, and MySQL. In fact, the Application Manager has two features that help monitor and administer MySQL databases: MySQL Performance Monitor and Database Query Monitoring. Together, these tools help DBAs manage and monitor the performance and availability of their MySQL databases.
Key Features:
- MySQL Performance Monitor: Monitors critical performance parameters of MySQL databases, including connection times, request times, thread details, query hit ratio, database and index sizes, and replication details, to maximize uptime.
- Database Query Monitoring: Monitors MySQL query performance by tracking specific critical queries and associating alarms to them, enabling instant notifications in case of abnormal performance.
- Data Sync Latency Monitoring: Keeps a check on the latency of data syncing between database servers and flags delays in synchronization, depending on the replication topology employed.
- Performance Forecasting: Compares historical performance reports of database servers to visualize future performance trends, allowing for predictions of future growth and utilization of MySQL databases.
- Custom Reporting: Offers flexibility to create custom reports that can be scheduled to run at required intervals, providing insights into MySQL server performance.
Why do we recommend it?
ManageEngine Applications Manager offers comprehensive MySQL monitoring and management capabilities, making it an excellent choice for database administrators and IT professionals. With features like MySQL Performance Monitor and Database Query Monitoring, it provides end-to-end visibility into the performance and availability of MySQL databases. Its robust managing, monitoring, alerting, and analytical capabilities ensure maximum uptime and optimal performance for MySQL servers.
All in all, Applications Manager's MySQL Management tool enables users to gain end-to-end visibility into the performance of their MySQL servers with its robust managing, monitoring, alerting, and analytical capabilities.
Who is it recommended for?
This tool is recommended for database administrators and IT professionals responsible for managing MySQL databases, particularly in environments where uptime and performance are critical. Its ability to monitor critical performance parameters, track query performance, and forecast future trends makes it suitable for organizations of all sizes seeking comprehensive MySQL monitoring solutions.
Pros:
- Deployment Options: Offers on-premise and cloud deployment options, providing companies with more choices for installation based on their preferences and requirements.
- Interdependency Mapping: Highlights interdependencies between applications to map out how performance issues can impact business operations, enabling proactive management and mitigation of risks.
- Log Monitoring: Offers log monitoring to track metrics like memory usage, disk IO, and cache status, providing a holistic view of database health and facilitating proactive troubleshooting.
- Real-Time Auto-Detection: Automatically detects databases, server hardware, and devices in real time, ensuring up-to-date monitoring and management of MySQL environments.
Cons:
- Learning Curve: Can take time to fully explore all features and options available, particularly for users new to the platform or unfamiliar with database monitoring tools.
DBAs can download a 30-day free trial which reverts back to the free version once it expires.
6. SolarWinds Server & Application Monitor
SolarWinds Server & Application Monitor (SAM) is a software-as-a-service (SaaS) platform with a web-based user interface; it deploys lightweight agents for specific tasks via multiple configurations. This makes it easy to install and use. It can be used to monitor MySQL databases in the cloud, local, or hybrid networking architecture environments.
Key Features:
- Comprehensive Monitoring: Monitors ALL servers and offers detailed monitoring with Database Performance Monitor extension for MySQL databases.
- Real-Time Monitoring: Provides 24/7 real-time monitoring to help attain Key Performance Indicators (KPIs) goals for availability, deployment frequency, and change lead times.
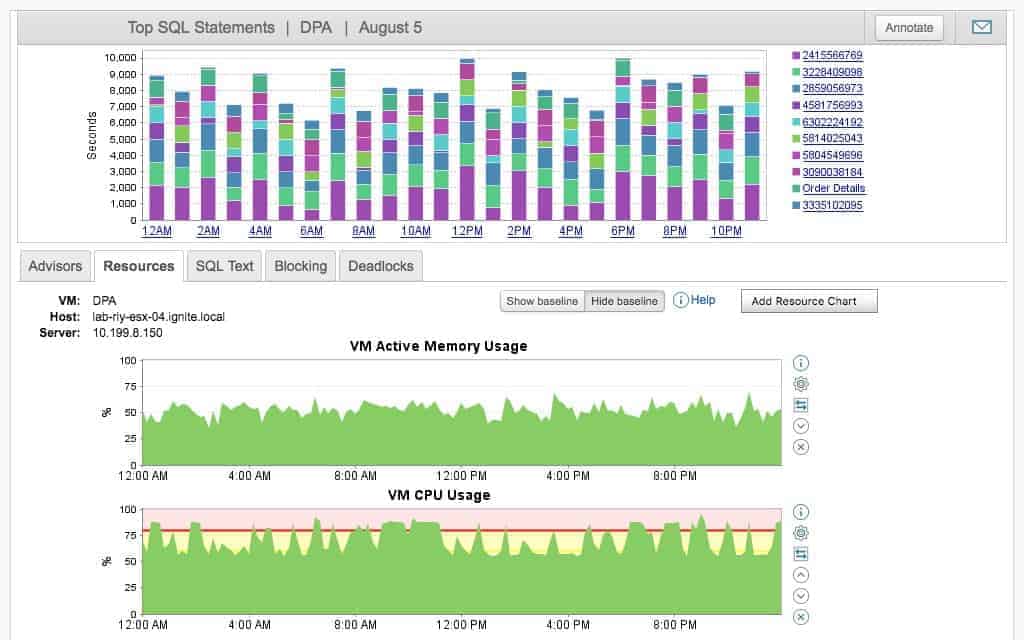
- Query Analysis: Root cause analysis, with drill-down capabilities into queries, EXPLAIN plans, and cross-correlation with other metrics like I/O and CPU.
- Data Classification: Monitors and classifies data on MySQL queries, users, databases, processes, and system components, enabling trend analysis and delta reports.
- Historical Data Storage: Stores both real-time and historical data for pinpointing, analyzing, and resolving current performance issues and making forecasts.
- Compliance Support: Utilizes multiple methods to protect sensitive data, aiding in achieving GDPR and SOC 2 compliance.
Why do we recommend it?
SolarWinds Server & Application Monitor (SAM) is a comprehensive software-as-a-service (SaaS) platform designed with large and enterprise networks in mind. Our recommendation is based on the platform's web-based user interface, lightweight agent deployment, and robust monitoring capabilities for MySQL databases across cloud, local, or hybrid networking environments. With features like real-time monitoring, query analysis, and data classification, SAM offers organizations a powerful solution for achieving Key Performance Indicators (KPIs) goals and optimizing server performance.
SAM stores both real-time and historical data that can be used to pinpoint, analyze, and resolve current performance issues as well as make forecasts. It also uses multiple methods to protect sensitive data which helps with achieving GDPR and SOC 2 compliance.
Who is it recommended for?
SolarWinds SAM is recommended for IT professionals and organizations requiring comprehensive server and application monitoring capabilities, especially those managing large and enterprise networks. It caters to businesses seeking a solution with auto-discovery, real-time monitoring, and robust alerting features for identifying and resolving performance issues effectively. Additionally, SolarWinds SAM is ideal for organizations needing support for MySQL performance monitoring and database management across diverse network environments.
Pros:
- Designed for Large and Enterprise Networks: Provides scalable monitoring capabilities and robust performance management features.
- Auto-Discovery: Builds network topology maps and inventory lists in real time, streamlining network management and inventory tracking.
- Effective Alerting Features: Balances effectiveness with ease of use, ensuring timely identification and resolution of performance issues.
- Customizable Dashboard: Uses drag-and-drop widgets to customize the dashboard, enhancing user experience and dashboard customization.
- Robust Reporting System: Pre-configured compliance templates, facilitating compliance reporting and audit preparations.
Cons:
- Designed for IT Professionals: May not be the best option for non-technical users requiring simpler monitoring solutions.
Download a fully functional 30-day free trial of SolarWinds Database Performance Analyzer for MySQL.
7. Percona Monitoring and Management Tool
Percona Monitoring and Management Tool (PMM) is a free and open-sourced database monitoring and management solution. It works with MySQL and all its variants: MongoDB, MariaDB, Amazon RDS MySQL, Aurora MySQL, ProxySQL, PostgreSQL – the tool even has dedicated dashboards for some of these versions – as well as Percona XtraDB Clusters.
Key Features:
- Support for MySQL Variants: Works with MySQL and its variants, including MongoDB, MariaDB, Amazon RDS MySQL, Aurora MySQL, ProxySQL, PostgreSQL, and Percona XtraDB Clusters, providing comprehensive support for diverse database environments.
- Security Threat Tool: Runs checks for common database security issues, identifies unexpected database queries, tracks security loopholes, and reduces data exposure, ensuring the security of business-critical database environments.
- Real-time Visibility and Forecasting: Offers real-time visibility, forecasting, and trends, allowing for drilling down into clusters and providing point-in-time and historical visibility of MySQL database performance for analysis.
- Query Analytics (QAN): Monitors the execution time of queries and provides detailed MySQL query execution time to understand the root causes of any latency, facilitating performance optimization.
- Security Audits and History: Provides real-time status of all databases and their details, including security audits and history, ensuring the security and integrity of MySQL databases.
Why do we recommend it?
Percona Monitoring and Management Tool (PMM) is an exceptional choice for database monitoring and management, particularly for MySQL environments. Its support for MySQL and its variants, along with features like real-time visibility, security threat detection, query analytics, and historical performance analysis, make it a comprehensive solution for ensuring the optimal performance and security of MySQL databases.
The company is known for its expertise in the development and support of various MySQL open software solutions that have proven to be highly-scalable.
Who is it recommended for?
This tool is recommended for database administrators and IT professionals responsible for managing MySQL databases, especially in environments where security and performance are critical. Its ability to simplify MySQL database management, improve security, and provide real-time visibility and analytics makes it suitable for organizations of all sizes seeking a reliable monitoring and management solution for their MySQL environments.
Pros:
- Open Source: Transparent and open-source project, allowing for community contributions and customization as per individual requirements.
- Wide SQL Environment Support: Works with a variety of SQL environments, including MySQL, PostgreSQL, and MariaDB, catering to diverse database environments and use cases.
- Built-in Security Audit Tools: Offers built-in security audit tools to detect and mitigate common database security issues, enhancing the security posture of MySQL databases.
- In-Depth Query Analytics: Manual reviews allow performance optimization and troubleshooting of MySQL databases.
- Free: Accessible to organizations of all sizes and budgets.
Cons:
- Limited Dedicated Support: May not be ideal for larger businesses seeking dedicated support or advanced features available in enterprise-grade monitoring solutions.
The latest version of Percona Monitoring and Management Tool can be downloaded for free.
8. AppDynamics MySQL Performance Monitoring
The AppDynamics Database Monitoring tool's MySQL Performance Monitoring module is a comprehensive round-the-clock in-depth monitoring tool used to oversee MySQL databases.
Key Features:
- End-to-End Application Performance Visualization: Provides visualization of end-to-end application performances using a browser, allowing for comprehensive monitoring and analysis of application performance.
- Real-Time Insights: Statistical data on MySQL databases and servers, including resource consumption, database objects, and schema statistics, enabling proactive issue resolution.
- Execution Plan Analysis: Shows execution plans for slow MySQL queries, helping identify performance bottlenecks and optimize query performance for enhanced efficiency.
- Trend Monitoring: Monitors key performance metrics over time, allowing DBAs to analyze performance trends and proactively tune MySQL databases for optimal performance.
- Delta Graphs: Displays MySQL server statistics in delta graphs, providing real-time visibility into server performance and facilitating quick troubleshooting.
- Query Statement Analysis: Enables one-click analysis of SQL statements' execution plans with drill-down capabilities, helping troubleshoot performance issues and optimize query performance.
- Historical Reports: Provides historical reports of delta comparisons, allowing for data-driven decisions about MySQL server optimization and performance tuning.
Why do we recommend it?
AppDynamics MySQL Performance Monitoring is a robust solution tailored for large-scale enterprise environments seeking comprehensive and real-time monitoring of MySQL databases. Its advanced features, including end-to-end application performance visualization, real-time insights, execution plan analysis, and historical trend monitoring, make it an excellent choice for organizations prioritizing performance optimization and proactive issue resolution.
Apart from MySQL, the tool also monitors DB2, Oracle, PostgreSQL, and MS SQL Servers from one central installation that can oversee an organization's entire data storage system.
Who is it recommended for?
This tool is recommended for database administrators and IT professionals managing MySQL databases in large-scale enterprise environments. Its ability to monitor and optimize MySQL performance, identify performance bottlenecks, and trigger alerts for threshold violations makes it suitable for organizations seeking to maximize the reliability and efficiency of their MySQL databases.
Pros:
- Tailored for Large-Scale Enterprise Use: Offers advanced monitoring and optimization capabilities for MySQL databases.
- Excellent Dependency Mapping and Visualizations: Troubleshoot complex application systems and identify performance bottlenecks.
- Includes a Free Version: Offers a free version with essential monitoring features, making it accessible to organizations of all sizes.
- Comprehensive Database Monitoring: Monitors not only MySQL but also other databases like DB2, Oracle, PostgreSQL, and MS SQL Servers, providing centralized monitoring for an organization's entire data storage system.
Cons:
- Better Suited for Larger Networks and Enterprise Environments: May be overly complex or feature-rich for smaller or simpler MySQL deployments, making it better suited for larger-scale enterprise environments.
AppDynamics offers a 15-day SaaS trial version of MySQL Performance Monitoring.
Why do you need MySQL monitoring tools?
Apart from automating the care of and administering a MySQL server, are there other advantages to using MySQL monitoring tools?
Yes, there are, they include:
- Accuracy in diagnosing issues to help cut their troubleshooting and remedying times.
- Forecasting to know what could happen in the future allows for accurate resource management and planning.
- Avoiding man-made errors before they occur helps cut the number of issues before they can cause interruptions.
- Alerts can be configured to keep an eye on systems round the clock, even when there are no DBAs around.
All in all, MySQL monitoring tools take the burden off of DBAs who need to have a complete insight into their databases, ensuring their optimal performances, and to remedy issues with the shortest amount of time and effort spent. They keep them a step ahead of issues and help them future-proof their assets, thereby enhancing the performance of DBAs and network administrators.
MySQL monitoring tools FAQs
How often should I perform MySQL monitoring?
The frequency of MySQL monitoring depends on the specific requirements of your environment and the size and complexity of the database being monitored. In general, it is recommended to perform regular monitoring on an ongoing basis to ensure that the database is running optimally and to identify and resolve issues as they arise.
What should I do if I encounter a performance or availability issue with a MySQL database?
Suppose you encounter a performance or availability issue with a MySQL database. In that case, the first step is to gather information about the issue and the environment, including resource utilization and query performance.
You can then use this information to identify the root cause of the issue and take appropriate action, such as optimizing queries, reconfiguring the database, or adding additional resources. If the issue cannot be resolved, you may need to seek additional support from the MySQL community or a third-party vendor.