We may earn a commission if you make a purchase through the links on our website.
Netdata Review and Alternatives
UPDATED: January 9, 2024
Netdata is an infrastructure monitoring and performance troubleshooting solution. Its hundreds of out-of-the-box integrations provide thousands of real-time metrics. This empowers IT and DevOps teams with more knowledge on their infrastructure, helping them improve their root-cause analysis, collaboration, and decision-making.
In this Netdata review, we’ll go over the details of Netdata. What is it, and how does it work. We’ll review its features and user interface. We’ll define a few of its pros and cons. And at the last section, we'll go over the top Netdata alternatives.
What is Netdata?
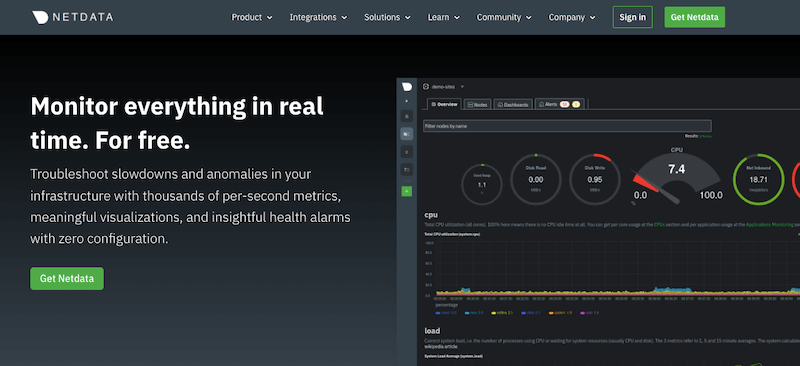
Netdata is an open-source, distributed, and real-time infrastructure monitoring platform. It keeps track of the performance and health of different environments using a per-second metric approach to monitoring.
With Netdata, you can collect any available metric (on a per-second basis) from your systems and apps using more than 300 agent collectors or the Kubernetes service discovery. You can then visualize all collected data via charts or insights using the cloud-based Netdata dashboard. With access to such data, you can monitor the health and performance with the pre-configured alarms, detect and analyze anomalies, store metrics data for months, and export them to other systems.
Product Details:
- Deployment The Netdata clients can be deployed on Linux, Docker, macOS, or Kubernetes platforms. Netdata Cloud can be accessed via the browser user interface.
- Mobile Mobile app unavailable. Use Netdata via the web browser.
- Customer support and knowledgebase Visit Netdata forums.
- Pricing model Netdata is free and open-source. However, they do provide three plans: Netdata Cloud open-source, Netdata Cloud (free version get it for free), and Netdata Cloud (paid, under-development as of February 2022).
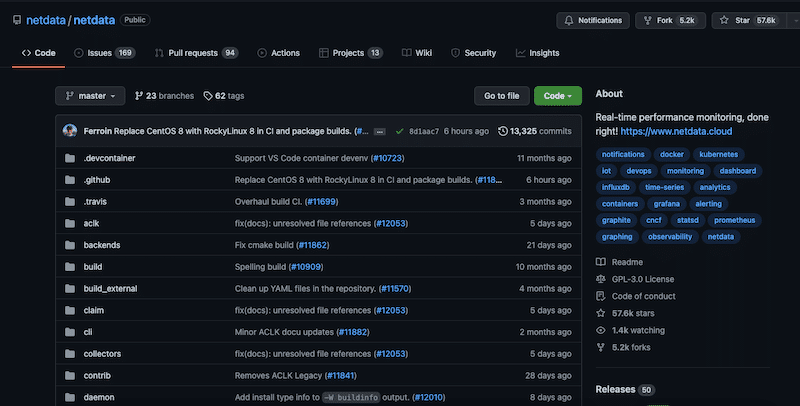
All Netdata components can be found on GitHub available under the GPL v3 license. Netdata is also a member of the Linux Foundation and Cloud Native Computing Foundation.
Who uses Netdata?
Netdata is designed for SREs, DevOps teams, developers, sysadmins, or any IT professional that needs to collect metrics from their systems and applications, visualize them in real-time, analyze them, and troubleshoot performance issues. Netdata allows collaboration between teams by sharing dashboards, organizing within war rooms, or assigning roles.
How does Netdata work?
Netdata works through two main elements, the Netdata Cloud and the Netdata Agent. Netdata Agents can be deployed on any single host within the infrastructure and are connected to the Netdata Cloud.
Netdata is based on a scalable streaming application. Each node running Netdata agents can stream the collected metrics (in real-time) to other nodes or a central database. The collected data is only streamed and not stored on the cloud.
What is a Netdata Agent?
Netdata Agents are lightweight monitoring software deployed on distributed assets, such as systems, hardware, virtual, containers, applications, or cloud environments. These agents require zero-configuration, as they are easily integrated and come with auto-detection mechanisms to find data sources.
The agents collect the metrics and forward them to the Netdata Cloud. As mentioned earlier, these agents do not transfer data, only stream it. The agent runs 24/7 and can be installed on popular operating systems, including most Linux distributions, macOS, FreeBSD, and container/microservices platforms.
What is the Netdata Cloud?
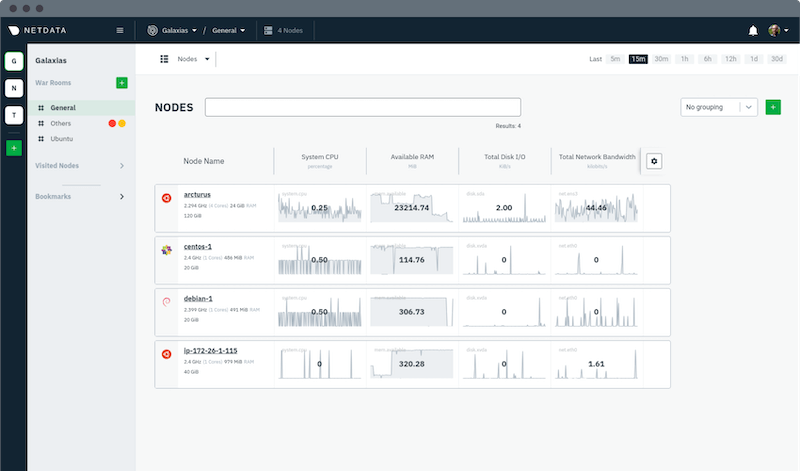
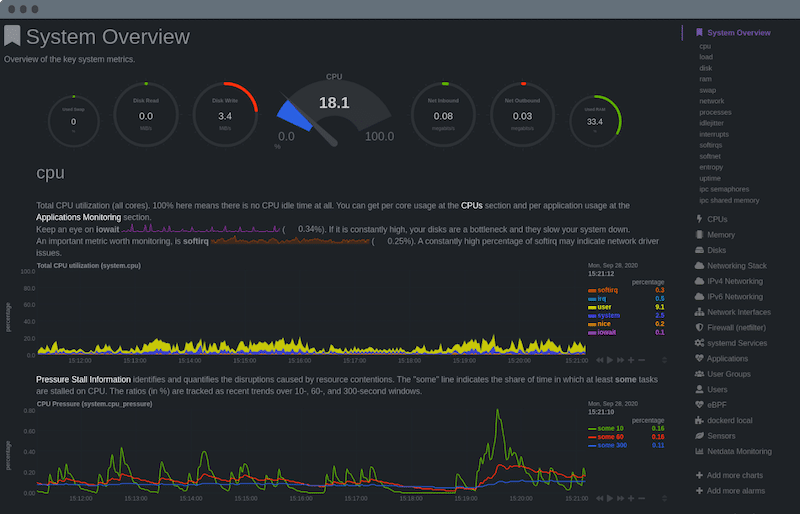
The Netdata Cloud is a central cloud-based space that allows you to keep track of all Netdata Agents and their collected data. It shows you real-time data visualizations, including vital metrics, insights, charts, active alarms, and more for all your monitored infrastructure. Although the agent’s data is shown in real-time, the data is not stored on the Netdata cloud but remains on the node. You can access Netdata Cloud via a web user interface.
Netdata provides a comprehensive Privacy Policy that explains how your data is treated. Netdata ensures that your data, whether email addresses, or technical details of your infrastructure, remains private.
Key Feature’s Review
- Numerous Integrations Netdata provides hundreds of zero-configuration integrations. You can view thousands of real-time metrics of your APMs, containers, VMs, data stores, logs, network, storage, remote devices, email, web, and many more. Check Netapp’s full integration list.
- Open-source. The Netdata engine is fully open-source software. It is maintained by a strong community of more than 300 contributors.
- Streaming for scalability. Netdata is data-agnostic. It is built for unlimited number, type, and frequency of streamed or collected metrics. Streaming metrics help ensure data privacy compliance, as the data is not sent or stored in the cloud, only streamed.
- Visual and powerful troubleshooting. Netdata collects thousands of real-time granular metrics and presents them in visualizations and charts for easier and faster root-cause analysis. You can spot issues, correlate metrics, and set reactive alerts. Netdata Cloud now is available with Netdata Cloud Charts 2.0
- Out-of-the-box alerting. Netdata comes with hundreds of pre-defined alarms that notify you via email, Slack, Discord, or PUSH actions. You can also customize the alerts. Define dynamic thresholds, role-based notifications, and alarm templates to help the team respond faster.
- Export metrics. You can export your vital or long-term metrics for more analysis or storage—export metrics to other time-series databases such as Prometheus or Graphite.
User Interface Review
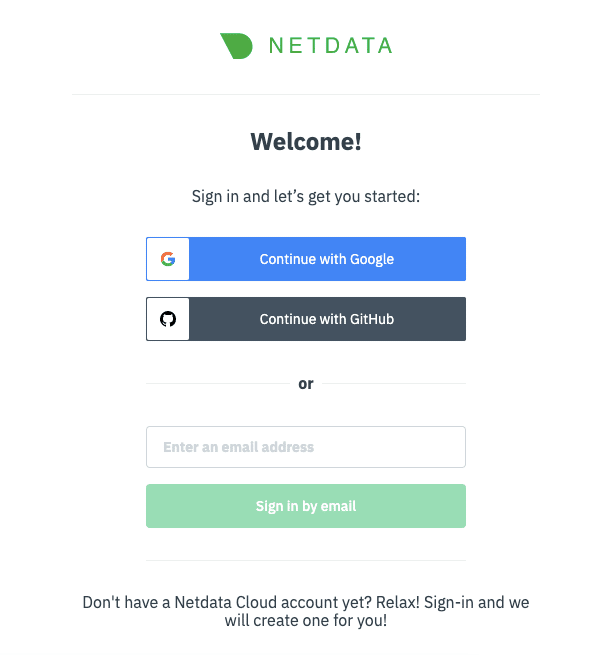
The user interface is secure, easy to access and use. You can use your Google or GitHub credentials to access NetData Cloud. Additionally, you can also create an account using your email.
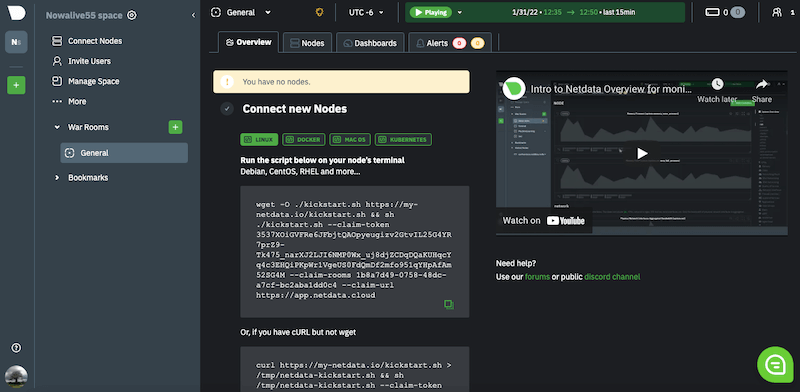
Below is an example of Netdata’s user interface at the start, where you have no nodes. The left-hand menu is the space management area. This area includes submenus like Connect Nodes, Invite Users, Manage Space, Manage War-rooms, Manage Users, and Manage Bookmarks.
Connect Nodes
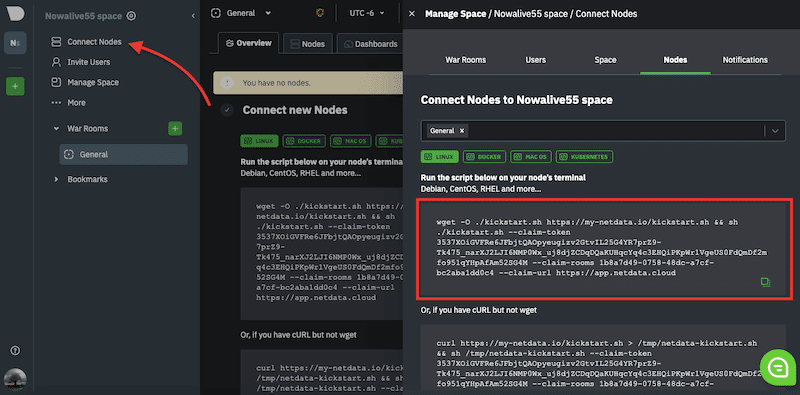
To connect nodes to your Netdata Cloud, you’ll need to install the agent’s software on each node. As shown in the screenshot below, the platform gives you the information on how to install Netdata’s agent on Linux, Docker, macOS, or Kubernetes platforms.
Invite Users
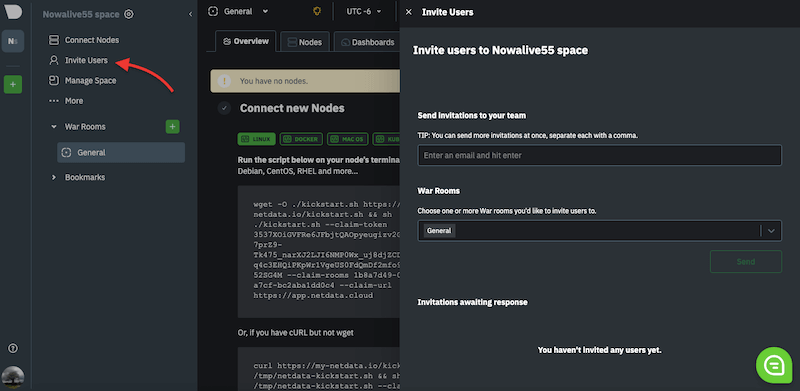
You can invite new users to your space by going to the Invite Users area. A new pop-up window will appear where you can send invitations to your team using their email addresses. You can sort users on one or more War Rooms.
Manage Space
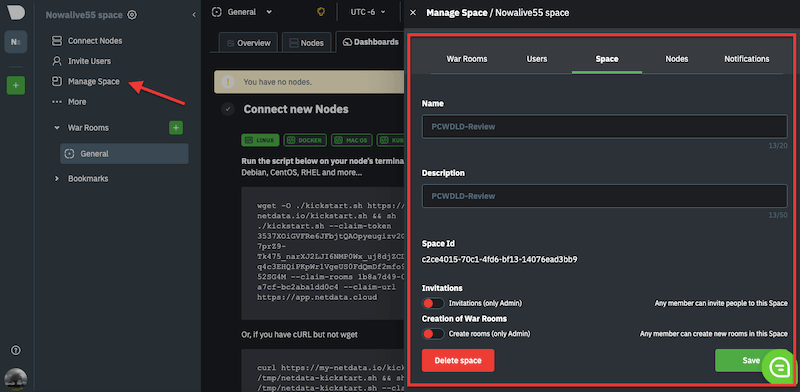
The Manage Space sub-menu item allows you to change your space’s name, add a description, and define permissions for invitations and war room creation.
War Rooms
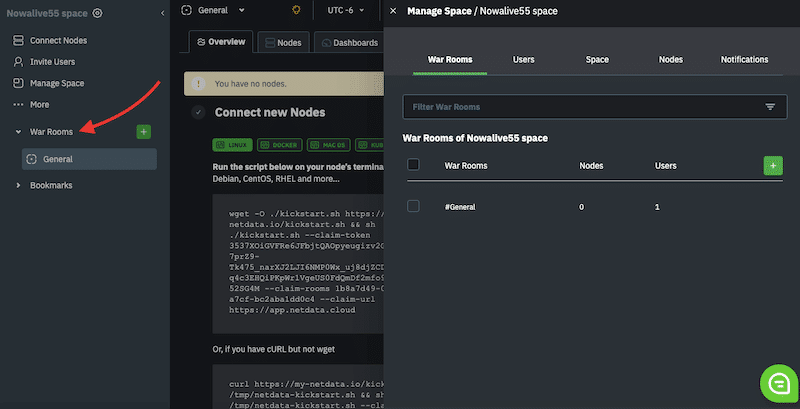
War rooms let you organize your nodes and configure dashboards with real-time metrics and visualizations. They provide segregation in order to improve root cause analysis. When you add nodes to your War Rooms, you can then use the dashboards to keep track of the performance and health of those specific nodes.
To create a War Room, go to the space management area on the left-hand side and click on War Rooms.
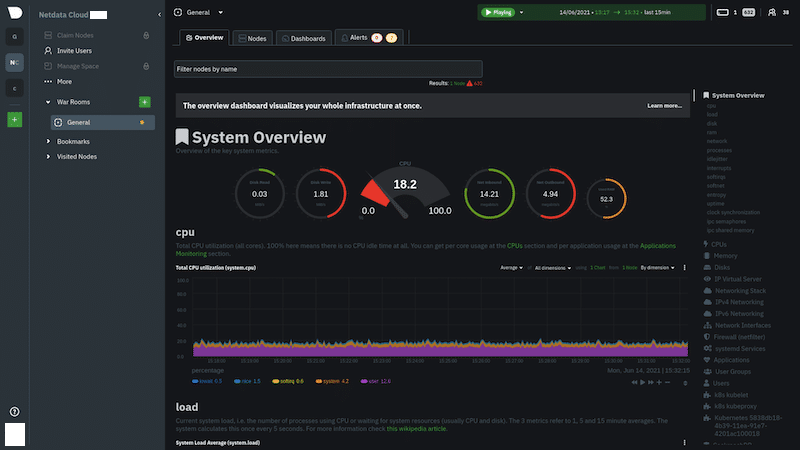
Below is an example of Netdata’s “General” War Room. It shows the complete system overview of one node.
Dashboards
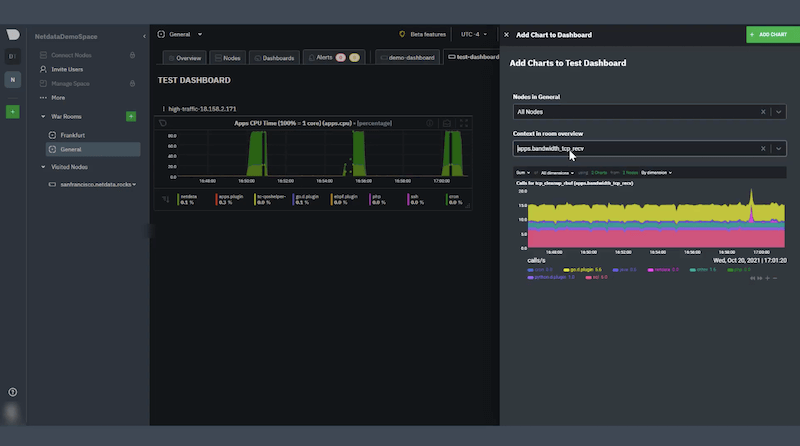
Netdata also allows you to build dashboards that pull metrics from any system or number of distributed systems and bring them to a single place. Netdata’s dashboards help you get a bird’s eye view (without having to move from node to node) of the performance and health of your entire infrastructure. They provide good insights to help you troubleshoot or keep an eye on your most vital metrics.
You can create a dashboard from the War Room that you want to monitor. Then, click on the Dashboard tab, and click on the “Green + Add” button. You can add specific nodes or all nodes and assign the context.
Netdata Pros and Cons
Below are a few pros and cons found in the Netdata platform. There are, clearly, more cons than pros.
Pros:
- Easy to install and use.
- Free to use and open-source. Well-mainteined in GitHub.
- Monitor many parameters at the grain level.
- Customizable dashboards and interactive graphs.
- Multiple altering systems.
- A true plug-n-play tool.
- It utilizes minimal resources.
- It integrates with Grafana and Prometheus (walkthrough).
Cons:
- Monitoring of Windows environments needs improvement.
- Lack of support for more third-party monitoring (APM) services and applications.
- Not optimal for analyzing historical incidents.
- Can’t isolate and aggregate stats from multiple nodes.
- Only accessible via the web browser.
Netdata Alternatives
Below you’ll find ten of the top alternatives to Netdata. All of them provide monitoring at different scales, prices, and capabilities. Some bring observability to the table through the use of AI/ML and automation but at a price, while others remain pure APM tools but remain open source and free.
- Site24x7 – FREE TRIAL Emerges as a strong alternative to Netdata in IT monitoring, offering an expansive solution that extends beyond real-time performance. Its capabilities in comprehensive IT infrastructure monitoring, AI-driven analytics, and integrated log management cater to organizations needing deeper insights and a unified approach to monitoring networks, servers, applications, and cloud services. Site24x7 stands out for its customizable dashboards and proactive incident response features, making it a suitable choice for complex IT environments. Start a 30-day free trial.
- Datadog A SaaS-based APM and observability product. It provides intelligent monitoring and analytics for cloud-scale applications. Datadog monitors the health and performance of your entire IT infrastructure, including servers, apps, databases, and more. Try a 14-day free trial of Datadog.
- Zabbix An enterprise-class open-source network and application monitoring solution. It allows you to keep track of your network nodes, servers, apps, VMs, databases, cloud services, and more. It provides both agent and agentless technology to keep track of thousands of metrics. Download the latest Zabbix version.
- Dynatrace An all-in-one cloud infrastructure and application monitoring platform. It includes services such as APM, AIOps (Artificial Intelligence for Operations), DEM (Digital Experience Monitoring), Automation, and Observability. Dynatrace also integrates with other monitoring, ticketing, and collaboration services. Sign up to Dynatrce to get a 15-day free trial.
- PRTG Network Monitor is a robust monitoring tool designed for small-to-medium networks. It allows you to monitor virtually any network component within your infrastructure from systems, apps, traffic, databases, wireless, storage, cloud, VMs, IoT, security, and more. Download PRTG100 for free to monitor up to 100 sensors or apply for an unlimited trial.
- Prometheus An open-source monitoring solution with a modern and robust alerting system. It uses a dimensional data model, a flexible query language, and an efficient time-series database. Prometheus is well-known for its ability to collect and query microservices data. Prometheus is free. Download the latest Prometheus version.
- AppDynamics, by Cisco, A leading APM, and full-stack observability solution. It uses ML and AI to provide real-time insights and visibility into your IT environments. With AppDyamics can keep track of metrics in the entire stack, from business, users, apps, infrastructure, network to security. Subscribe to get a 15-day trial.
- Grafana A free and open-source observability platform. It is used for analytics and monitoring via metrics data visualization and formatting. Grafana allows the creation of dashboards and graphs using data from multiple sources such as time-series databases. Sign up to create a free forever plan for the Grafana Cloud.
- LogicMonitor An automated cloud-based infrastructure monitoring and observability platform. It is designed for enterprise IT and Managed Services Providers (MSPs). LogicMonitor covers thousands of technologies out-of-the-box with zero configuration. It provides data insights, collaborations, and full visibility of your entire infrastructure. Sign up for a free 14-day trial.
- PagerDuty A leading incident management platform built for improving Dev and IT Operations. It provides DevOps and ITOps teams with insights and alerts so that they can respond quickly, collaborate, and solve incidents. PagerDuty provides reliable incident alerting, automated incident response, on-call management, event management, and more. Subscribe for a 14-day free trial.
- xMatters An advanced cloud-based IT alerting management solution for medium-to-large businesses. It is designed to help DevOps, SRES, and ITOps keep up site reliability. xMatters achieves this by automating incident management, alerting intelligently, automating workflows, providing analytics, and more. Sign up to xMatters for a free trial.
Final Verdict
Many system admins prefer Netdata simply because of its diverse out-of-the-box integrations and access to thousands of per-second metrics. It gives them complete control over their applications and systems with the help of meaningful visualizations and intelligent health alerts that require absolutely no configuration.
Good open-source alternatives for Netdata are Zabbix, Grafana, or Prometheus. But if you are looking for more capabilities such as observability, AIOps, and automation, you’ll have to look somewhere else. Good alternative options with robust APM, observability, user-experience monitoring, and more, are Dynatrace, Datadog, and AppDynamics.