We may earn a commission if you make a purchase through the links on our website.
The Best PostgreSQL Monitoring Tools
UPDATED: November 26, 2024
Accurately monitor, manage, and report on your PostgreSQL instances with these nine tools.
Your network infrastructure and web applications may suffer significantly if your PostgreSQL instances are left unchecked, leading to improper load balancing, performance issues, and ultimately failures. Without assistance, you need to monitor a wide range of unique metrics that are frequently unclearly displayed as direct log data, or not shown at all, to help you make sure your PostgreSQL servers are functioning properly. This is where third-party monitoring tools come in handy, by integrating with your PostgreSQL instances and displaying accurate feedback on your live data.
Here is our list of the best PostgreSQL Monitoring Tools:
- ManageEngine Applications Manager – EDITOR'S CHOICE A comprehensive PostgreSQL monitoring package that offers real-time dashboards for parameters relating to the health of the back-end and front-end servers. Access a 30-day free trial.
- Site24x7 – FREE TRIAL Data can be retrieved from a web-based monitoring platform using PostgreSQL integration and shown in charts and monitoring dashboards. Start a 30-day free trial.
- Paessler PRTG Network Monitor – FREE TRIAL To assure accurate data collection, Paessler PRTG Network Monitor includes a fully functional PostgreSQL monitoring sensor that can be coupled with your PostgreSQL servers. Access the 30-day free trial.
- Datadog Provides a quick installation and thorough insights into your data metrics by fully integrating PostgreSQL as part of the installation agent.
- SolarWinds AppOptics A platform for applications that continuously monitor and fully integrate PostgreSQL servers. The solution has a rapid setup and installation process and offers a comprehensive overview of health and performance data.
- New Relic Premium services can be added to this otherwise free monitoring platform that contains PostgreSQL services that add intelligent health and performance monitoring.
- SolarWinds Database Performance Analyzer This product has an emphasis on cross-platform database performance tweaking and optimization when dealing with PostgreSQL and other database instances.
- pgCluu While there are a few open-source PostgreSQL monitoring tools on the internet, pgCluu is one of the best, with a straightforward presentation and high customizability.
- SolarWinds Loggly A different log analysis tool that can fully connect with SolarWinds AppOptics to combine log data and provide comprehensive PostgreSQL monitoring.
These tools work by pulling crucial metrics from your PostgreSQL servers and legibly displaying them to have a better understanding of the state of your data. This article discusses various approaches to deciphering your HAProxy performance and health indicators; although you can combine various product categories to broaden your monitoring, most often you just need one service.
Some of the best tools for keeping an eye on the health of your PostgreSQL servers are covered in this post. Whatever approach you decide to take, the most important thing is that your data will be presented legibly. In general, each of the solutions on the list also has a notification system that alerts you to potential health issues. Load balancing is another feature presented by some of the higher-end products, either natively or through integrations
The Best PostgreSQL Monitoring Tools
1. ManageEngine Applications Manager – FREE TRIAL
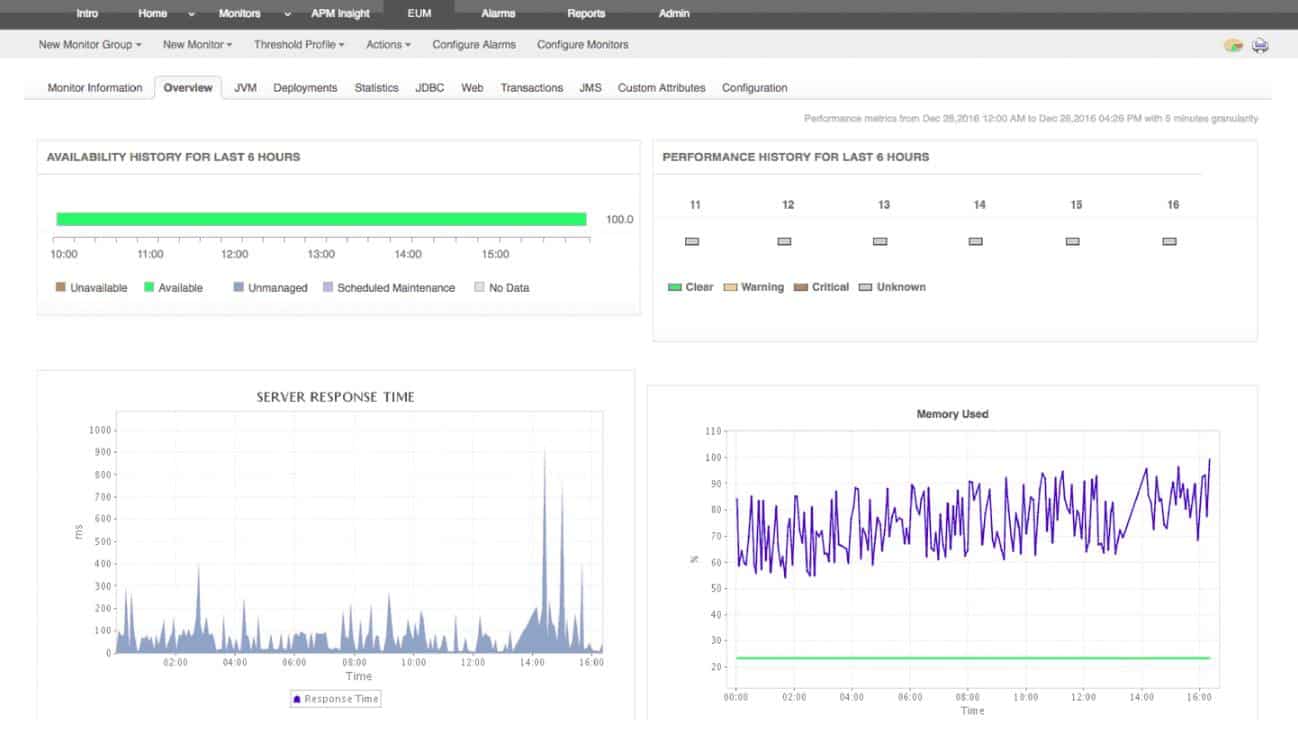
PostgreSQL is fully integrated with ManageEngine Applications Manager, enabling you to access comprehensive performance metrics and monitor PostgreSQL capacity data. Monitor and fix problems with server performance and health in physical, virtual, and cloud settings, and avoid server outages by ensuring that your PostgreSQL instances have enough resources, and efficiently plan for capacity. The monitoring tool can also retrieve frontend information like client connections and examine general user behavior.
Key Features:
- Health metric aggregation
- Alarms for health risks
- Customizable dashboards
- Hotspot detection
- Smooth integration
By comparing your frontend and backend metrics and locating hotspots, the configurable dashboards can greatly simplify health monitoring. Additionally, alerts can be set up to alert you anytime the health of your PostgreSQL servers is in danger—Find the exact and speedy solution to problems with static and dynamic thresholds with AI-assisted proactive detection of anomalies based on changing baselines.
There is a free version of ManageEngine Applications Manager that can be downloaded from the website and supports up to 5 apps or servers being watched. The Professional and Enterprise editions of the service also provide a free trial.
Ten separate service monitors are included in the Professional version's $395 annual price, or you can pay $795 for a perpetual license. Up to 250 displays, the Professional version's price scales with the number of monitors. The Enterprise version scales higher and starts at $9,595 per year for 250 monitors. Start a 30-day free trial.
EDITOR'S CHOICE
ManageEngine Applications Manager is our top pick for a PostgreSQL monitoring tool because it provides a suite of features to ensure optimized database performance and reliability. The tool provides real-time monitoring for critical PostgreSQL metrics, such as query performance, memory usage, disk I/O, cache hit rates, and connection statistics. This level of detail enables database administrators to detect inefficiencies and bottlenecks swiftly, keeping the database running smoothly even under high loads. Applications Manager is fronted by a well-organized dashboard, where users can visualize PostgreSQL health metrics across various instances. By monitoring key performance indicators like query execution times and lock contention, administrators can take proactive steps to optimize database performance and avoid downtime. The package includes automated alerting that notifies admins of potential issues, such as resource exhaustion or unexpected behavior, allowing for faster issue resolution. Another significant advantage is Applications Manager’s support for capacity planning through historical data and trend analysis. This feature helps administrators forecast future database needs and make informed decisions on resource allocation. ManageEngine Applications Manager provides a comprehensive PostgreSQL monitoring solution, making it the top pick for businesses seeking thorough and reliable database oversight.
Download: Get a 30-day FREE Trial
Official Site: https://www.manageengine.com/products/applications_manager/download.html
OS: Windows Server, Linux, AWS, and Azure
2. Site24x7 – FREE TRIAL
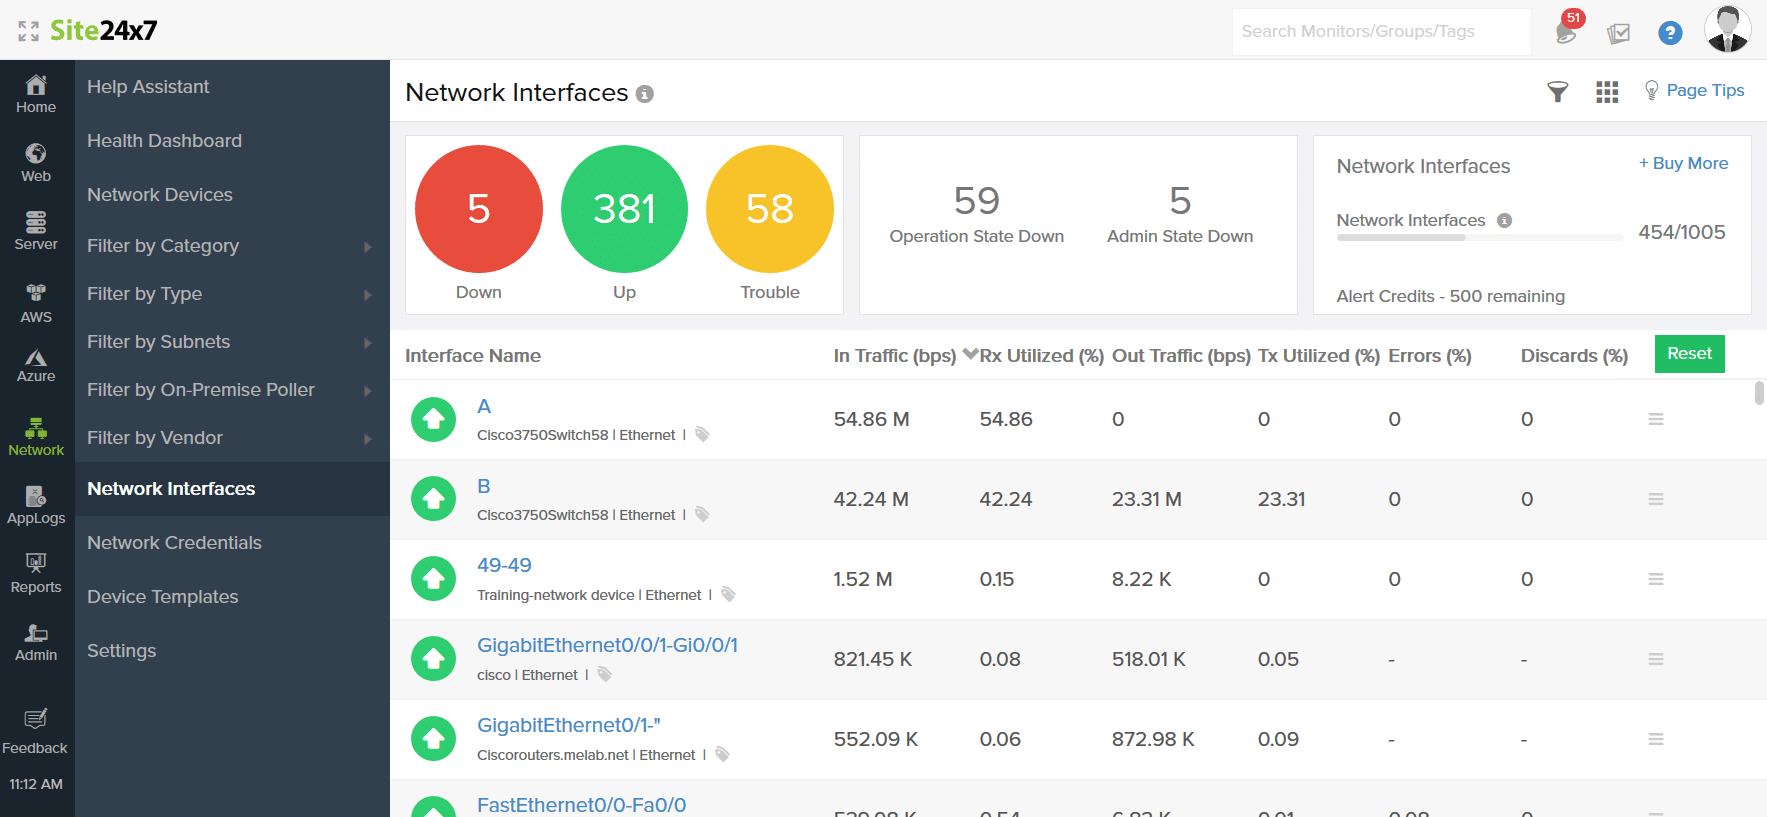
A web-based monitoring service from Site24x7 comes with a PostgreSQL plugin, making integration relatively simple. The platform can consolidate the health and performance monitoring data and track all common indicators from the PostgreSQL servers and can allow you to keep track of outages and locate server problems with root cause analysis tools. You can create unique plugins, then keep an eye on important properties, and obtain total insight into all of your PostgreSQL resources.
Key Features:
- Plugin for easy integration
- Performance and health metric aggregation
- Monitoring dashboards
- Service and process monitoring
- Flexible pricing
For a thorough assessment of the server's condition, the request errors, frontend, and backend metrics can be combined and compared. Site24x7 also offers a flexible scaling pricing approach, allowing you to precisely tailor your service requirements. Utilize your application logs across servers and data center locations to gather, consolidate, and diagnose issues. The beginning is relatively simple thanks to supporting common programs and log frameworks.
The base price for the Infrastructure Monitoring package is $10 per month, which covers ten servers, websites, or cloud instances. In groups of 10, 50, and 500 additional instances, you can add more to pinpoint your precise service needs. Additionally, Site24x7 provides a 30-day free trial so that you may become comfortable with the platform's PostgreSQL health monitoring features.
3. Paessler PRTG Network Monitor – FREE TRIAL
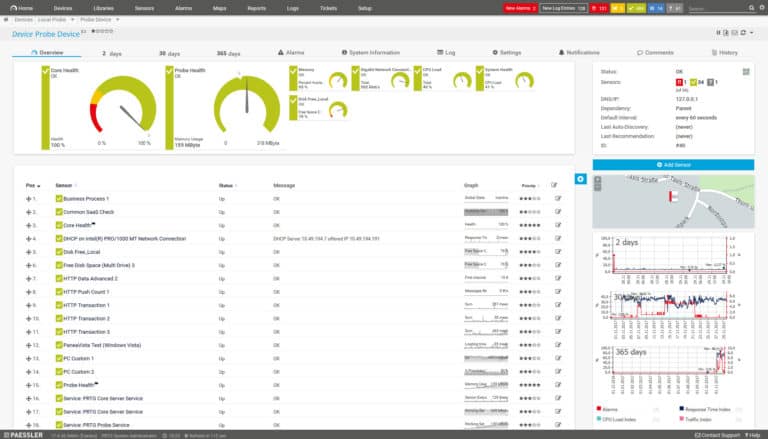
Paessler PRTG Network Monitor comes equipped with a full-featured PostgreSQL monitoring sensor that can be integrated with your PostgreSQL instances to ensure precise data capture. The system can allow you to find out how much bandwidth your hardware and software are utilizing, and locate any bottlenecks, using built-in notification mechanisms, such as email, push notifications, or HTTP requests. Use dependencies to prevent alarm floods, or customize the notification system to your needs by scheduling alerts (such as “no low priority alerts at night”).
Key Features:
- Numerous integrations
- Comprehensive dashboarding tools
- Customizable notification system
- One-time perpetual license
- Cluster failover solution
With specially tailored SQL queries and PRTG sensors, you can keep an eye on particular datasets from your databases, and manage and centrally monitor all of your cloud computing services from any location. Utilize more than 300 different map items, including device and status symbols, and traffic charts to build dashboards using the PRTG map designer.
Paessler PRTG Network Monitor comes with a 30-day free trial for you to test out all available features. The full product is packaged as a one-time perpetual license, with pricing targeted towards larger businesses that are heavily reliant on this kind of professionally presented monitoring solution.
Costs are based on the number of individually monitored aspects, with the PRTG 500 license costing $1,799—whereas on the other end of the scale, the PRTG 5000 costs $11,999. These costs are for a single server license, but can cover the respective number of ‘aspects’.
4. Datadog
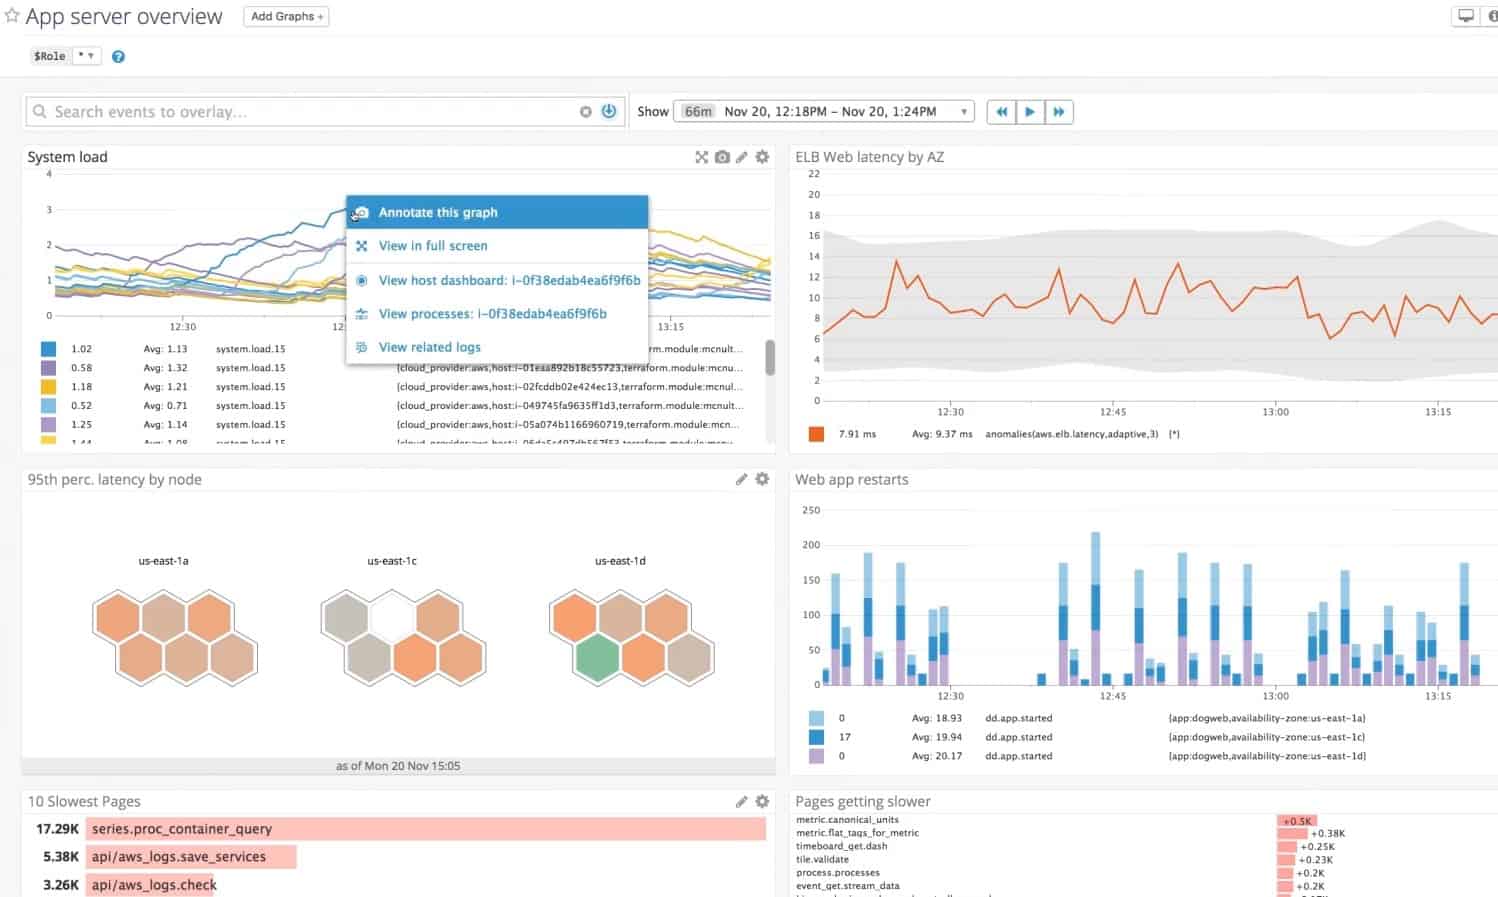
Since Datadog already has a PostgreSQL package included within the installation agent, integrating it to completely monitor your PostgreSQL instances won't take much time or effort. Additionally, you can track your front-end and back-end traffic data using the solution's fully configurable dashboards.
Key Features:
- Fast installation & integration
- Customizable dashboards
- Health and performance data correlations
- Down notifications
- Balancing with other integrations
Set-up restrictions and alerting systems are customizable to make sure you keep an eye on the health of your PostgreSQL servers. You may utilize the performance data to compare and balance your PostgreSQL instances with other servers and applications by integrating additional services into Datadog.
To test the PostgreSQL integration and discover how well it works with your infrastructure, Datadog offers a full 14-day free trial. The free version offers the essential functions, but the PostgreSQL integration requires the Pro edition, which costs $15 per month per host and is at a minimum required.
With the addition of data forecasting, which enables you to make predictions, and AI-driven alerting, which may be useful depending on the size of your infrastructure and the demands placed on the PostgreSQL server, the Enterprise edition can enhance the features of the Pro version.
5. SolarWinds AppOptics
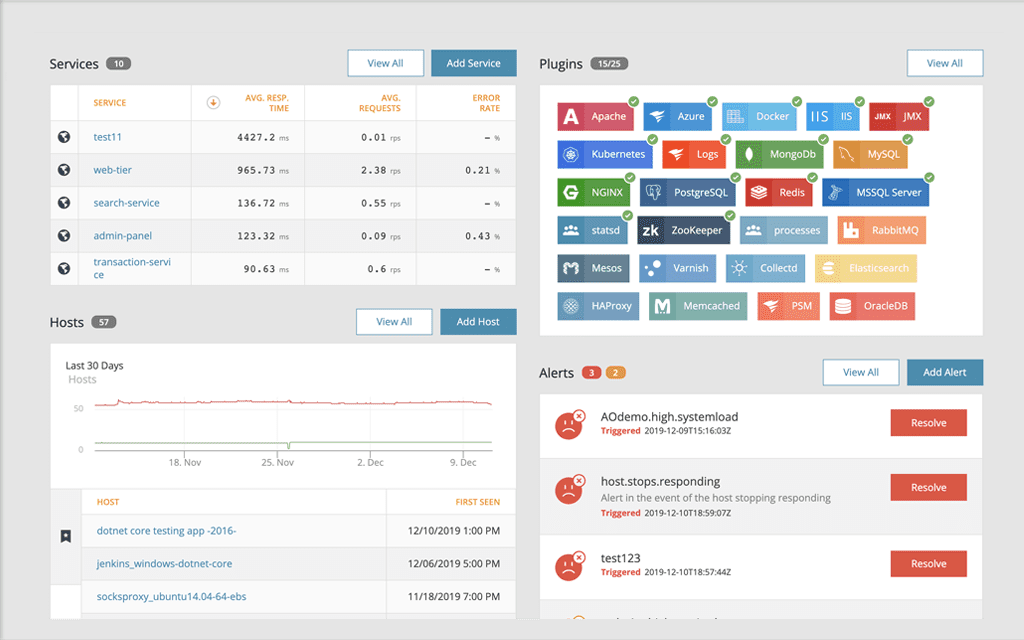
An integration plugin for PostgreSQL health and performance monitoring is available in SolarWinds AppOptics, a platform for continuous application monitoring. To improve your ability to debug, the solution can offer in-depth insights into your mistakes and server downtime. Additionally, SolarWinds offers several pre-configured dashboards to simplify setup procedures and enable instant PostgreSQL health statistic monitoring.
Key Features:
- Integration plugin for PostgreSQL
- Wide variety of monitoring metrics
- Full-stack app monitoring
- Customizable or Pre-set dashboards
- SolarWinds Loggly integration
SolarWinds Loggly is another solution featured in this article. You can establish integrations between these two platforms if you want to greatly improve your monitoring capacity. This makes it simple to combine and evaluate log and performance indicators to identify the root of any issues and provide exact timings for improved load balancing requirements.
The website offers a full 30-day free trial of SolarWinds AppOpticts. SolarWinds sells the AppOptics solution in “packs” of 10 hosts and 100 containers, splitting it into Infrastructure Monitoring and Application Monitoring. The cost per host each month for the Infrastructure Monitoring solution is about $10—plus the $25 per host per month cost for the Application Monitoring package.
6. New Relic
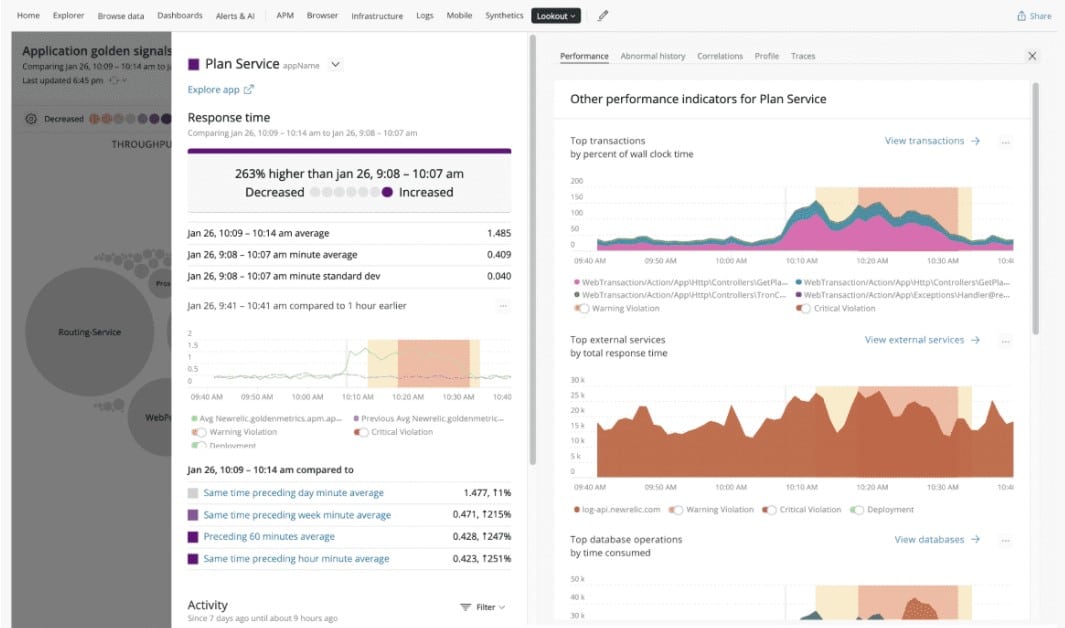
Depending on your monitoring and scaling needs, New Relic offers a comprehensive yet free alternative to PostgreSQL monitoring with the option to upgrade to premium and enterprise-grade versions. You can set up total health and performance metric monitoring by installing the infrastructure agent or integrating with Kubernetes/Amazon ECS.
Key Features:
- Variable pricing model
- Monitoring alerts
- Metric labeling
- Front and Backend metric comparisons
- Customizable dashboards
The system is designed to allow you to start noticing hidden faults right away, with no complicated configuration required. For improved monitoring awareness, New Relic offers a range of programmable dashboarding options and warning systems. Get comprehensive app visibility, from frontend hardware to backend APIs, and remediate issues quickly with the use of strong distributed tracing and thorough transaction information.
Additionally, you can add your labels to metrics to enhance data filtering and querying. Any volume of on-premises and cloud data may be easily ingested, searched, and segmented however you like. Use machine learning to quickly investigate millions of log messages with a single click and find trends, and receive logs in context to rapidly correlate issues.
New Relic is cost-free for a single user for up to 100GB of data each month. Five users are allowed in the Standard version, whereas numerous full-access users are allowed in the Pro version. For a customized price quote, get in touch with New Relic's sales team.
7. SolarWinds Database Performance Analyzer
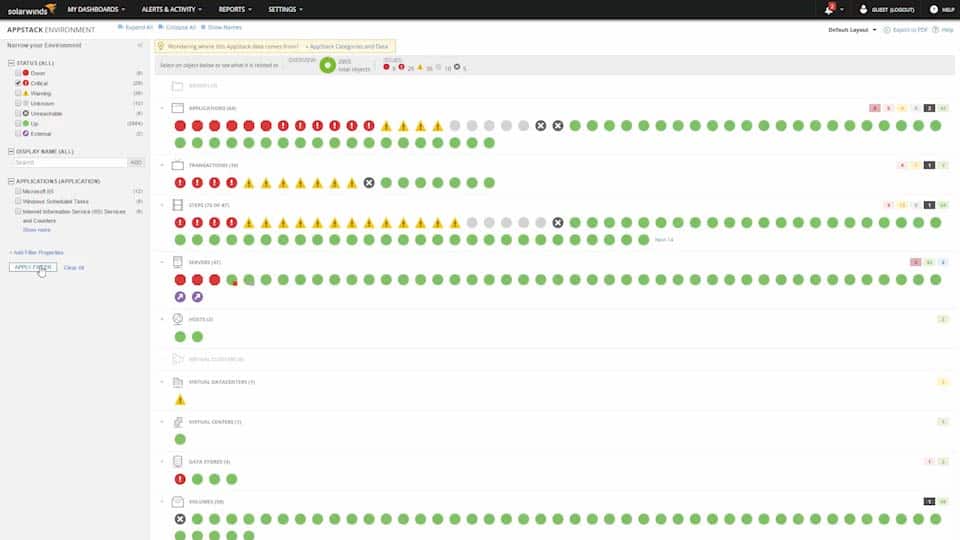
SolarWinds Database Performance Analyzer provides continuous server monitoring, with a focus on cross-platform database performance tuning and optimization when dealing with PostgreSQL, and other database instances. Developers, SREs, and DBAs can all benefit from DPM, presenting itself as a fully equipped PostgreSQL monitoring tool that offers a SaaS-based user interface.
Key Features:
- Cross-platform database support
- Load management
- Custom alerts and dashboards
- Scalable SaaS platform
- Agentless install
The solution supports a wide range of database platforms, including MySQL, SQL Server, and Oracle. End-to-end IT performance management is provided via deep PostgreSQL query optimization and analysis, machine learning, and integration with other SolarWinds products. Where the solution shines above others (such as SolarWinds AppOptics) is its ability to intelligently compare data between different kinds of databases.
SolarWinds Database Performance Analyzer has a 30-day free trial available to download and install from the SolarWinds website. For the full product, contact SolarWinds directly for a personalized quote on pricing.
8. pgCluu
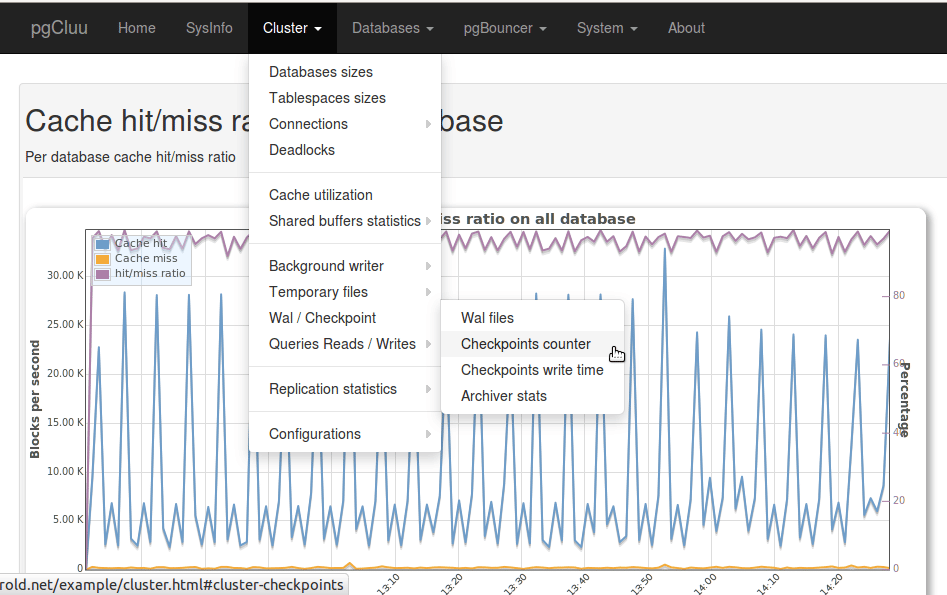
pgCluu is an open-source and completely free solution, and while there are a few open-source PostgreSQL monitoring tools available on the internet, pgCluu is one of the best. The PostgreSQL cluster performance can be fully audited using the Perl software. It is split into two parts: a grapher that will produce all HTML output and charts, and a collector that uses psql and sar to gather statistics from the PostgreSQL cluster.
Key Features:
- Open-source PostgreSQL monitoring
- Load balancing integration
- Fully customizable outputs
- Data caching
While it lacks some of the features you might expect from a premium product, pgCluu has features such as integration with PgBouncer, a load balancing and failover system that is also open-source and free. Open-source also brings the benefits of the product being highly integratable with your existing systems, provided that your team has the know-how to either find or develop your third-party connections.
pgCluu is completely free to download and install from GitHub, you can find detailed installation instructions also on the GitHub page. This solution is perfect if you want a product on a budget, or if you need the customizability of an open-source system.
9. SolarWinds Loggly
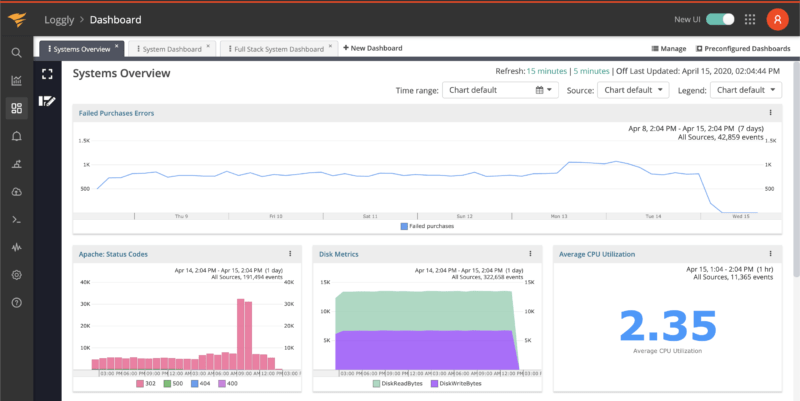
Your PostgreSQL instances can be integrated with SolarWinds Loggly, a log parsing, and analysis tool, to retrieve log data using a Syslog daemon. While the installation process can be very complex and necessitates setting up several unique installation parameters to interface with Loggly, once set up the solution integrates and operates seamlessly with your PostgreSQL instances.
Key Features:
- APM integrated log analysis
- Customizable dashboard
- Scalable full-stack log management
- Automated log summaries
- Longer setup requirements
However, the service's primary focus is on performance monitoring using its APM systems. It offers a way to examine health and performance parameters through log data. It can combine with SolarWinds AppOpticts (another solution highlighted higher in this article) for more extensive monitoring, providing warning systems and a better picture of your server's health.
The cost of the SolarWinds APM Integrated Experience component for the log management and analytics solution is $79 per month. There is also a 30-day free trial period for each known component. You might want to think about extending your purchase with further capabilities like Real User Monitoring or Infrastructure Monitoring, which complement the Loggly component.
In Summary
This article covered nine of the best PostgreSQL monitoring tools available on the market. While all of these tools are generally the same in terms of their fundamental feature set, the difference is in a combination of scope, price, and extra features.
If you’re looking for the absolute barebones system, with high flexibility and customizability on a budget, then the only open-source and free solution features in this article—pgCluu—is worth looking into. While it goes outside the scope of this particular article, there are a few open-source PostgreSQL monitoring tools if pgCluu doesn’t quite fit your needs; check out pgAdmin or Pganalyze if this describes your situation.