We may earn a commission if you make a purchase through the links on our website.
Sciencelogic Review & Best Alternatives
UPDATED: December 4, 2024
ScienceLogic is a leading provider of IT operations management and AIOPs solutions. Their software empowers intelligent and automated IT operations for large businesses and enterprises. The ScienceLogic SL1 platform ingests all sorts of data from any environment, makes it visible in one place, provides actionable insights through AI/ML, and allows automation and synchronization capabilities.
In this ScienceLogic review, we’ll go into full detail about ScienceLogic, how the ScienceLogic SL1 works and how to use the GUI. In the last section, we’ll provide the top eight alternatives.
Here is our list of the best ScienceLogic alternatives:
- Datadog Modern cloud-based monitoring system that gives detailed overviews of your servers, databases, and other third-party tools integrations. You can monitor external as well as internal changes done on your network in real-time.
- Dynatrace AI-powered cloud platform that monitors end-to-end IT infrastructure. This tool works perfectly with a multi-cloud environment for monitoring full stack and solving critical issues.
- Splunk Uses artificial intelligence to detect threats and shows a complete report of problems to solve them before they get worse.
- New Relic One Top-notch full-stack analysis tool that provides AI-powered insights and is scalable, allowing 700-plus integrations according to use.
- Broadcom AIOps solution Helps improve the digital experience with the use of AIOps to manage and monitor complex and dynamic technologies and stacks.
- Cisco AppDynamics Powered by Cisco, which helps to simplify and understand the backend operations to meet the user priorities and ensure a better user experience.
- LogicMonitor Easy to deploy and shows only what needs improvement on an urgent basis. It includes automatic support and a dashboard for over 200 types of infrastructure and apps.
- Zenoss Excellent full-stack monitoring tool suitable for managing and normalizing machine data to prevent disruption and complexity in the modern environment.
What is ScienceLogic
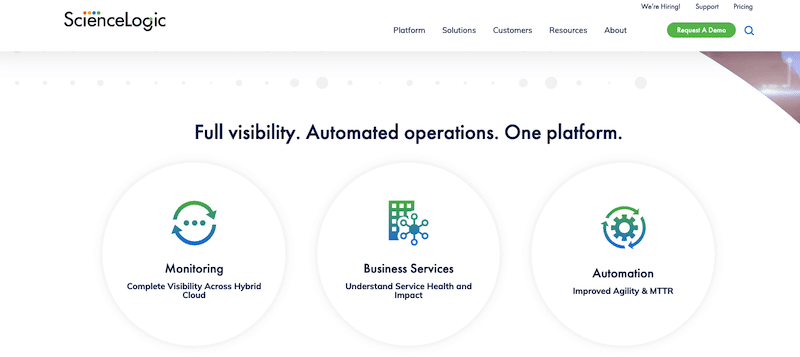
ScienceLogic is an IT Operations Management (ITOM) and Artificial Intelligent for IT Operations (AIOps) software provider. The company has headquarters in Virginia, USA, with branch offices in Australia, UK, Singapore, and Taiwan. Their software empowers intelligent and automated IT operations and improves complex distributed IT services management.
Their context-infused AIOps and IT infrastructure monitoring ScienceLogic SL1 platform can be deployed across clouds and distributed architectures. It provides you with a single platform with immediate insights into what’s actually happening across your infrastructure and applications.
ScienceLogic’s architecture follows three key steps:
- Visibility Automatically discovers, collects, and shows the data in one place.
- Context Applies AI/ML to give you actionable insights.
- Action Integrates into your IT ecosystem to automate responsive and proactive measures in real-time and at scale.
CRN has awarded ScienceLogic as one of the 20 coolest cloud monitoring and management companies of 2021. ScienceLogic has also been labeled a leader in the Forrester Wave Q2 2019 in ‘Intelligent Application and Service Monitoring.' In addition, it was also awarded by Forrester Wave for 2020 as a leader in Artificial Intelligence for IT operations. Check out their ScienceLogic company profile to know more about their awards.

Product Details
- Deployment On-premise, cloud, or hybrid, via an agent or agentless technologies.
- User Interface Web-based Graphical User Interface.
- Customer type From medium business to enterprise, global system integrators, Managed Service Providers, government, and the public sector.
- Customer Support Phone, online ticketing system, comprehensive documentation, knowledgebase, and training.
- Use Cases Automated ITSM workflows to accelerate incident response, automated troubleshooting, and remediation, and hybrid cloud monitoring.
- Pricing Offers four different plans, Base, Standard, Advanced, and Premium. Request the price.
- Free Trial You can request a demo.
ScienceLogic Pros and Cons
Pros:
- UI is easy to use
- Amazing device discovery and agents/agentless technology
- Special licensing options for nonprofits and educational institutions
- Ingest data from many different sources
- Fantastic built-in automation tools
- Dashboards to build your custom views
Cons:
- Support needs improvement
- Built-in reporting can be complicated
- Scaling environments can become pricey
- Reporting tool could be enhanced
- Can’t push configuration and commands
How ScienceLogic works
Discovery and Data Collection
- Discovery Uses a patented discovery technique to find assets in your IT environment, allowing greater visibility across all systems running on your premises or cloud.
- Data Collection Uses agent or agentless data collection techniques. The SL1 agent is software that you can install on the target monitored device, interface, or other components. It collects data and reports it back periodically to the SL1 platform. Agent technology is one of the most efficient ways to collect more granular data from the monitored device.
The ScienceLogic SL1 platform can also leverage the IT infrastructure’s existing monitoring and management capabilities through agentless technology, such as SNMP or remote shell access via SSH. The combination of agent and agentless monitoring capabilities allows ScienceLogic to keep track of cloud-based or on-premise assets.
Visualize, Contextualize, and Act
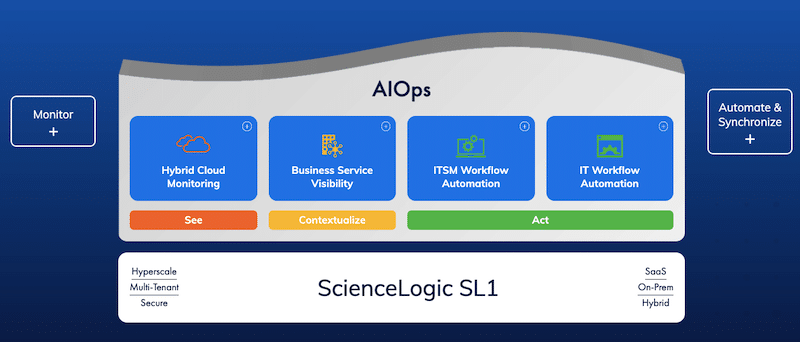
The ScienceLogic SL1 is a multi-layered technology platform that allows you to discover all components across hybrid cloud environments, apply AI/ML to contextualize data and gain visibility, and finally act via automation systems. First, ScienceLogic SL1 takes the collected data across multiple data sources and aggregates, cleans, and normalizes it. It then implements its ML-driven behavioral correlation to accelerate root-cause analysis. And, finally, it provides automation and synchronization solutions.
Automate and Synchronize
ScienceLogic allows you to run multi-directional integrations to automate responsive and proactive actions at a cloud scale. It provides an extensive library of more than 500 pre-built integrations. Available integrations range from Microsoft Windows Server, Juniper, NetApp, ServiceNow, Oracle, Dynatrace, VMware, AWS, Cisco, Docker, and many more.
ScienceLogic allows you to:
- Use ScienceLogic APIs, workflows, and streams to connect your IT ecosystem and transform data
- Automate ITSM and IT workflows fast and easily
- Update your Configuration Management Database (CMDB)
- If you want to add a customized integration, you can also leverage ScienceLogic’s flexible SDK
The ScienceLogic User Interface
The ScienceLogic GUI is self-intuitive, clean, and easy to navigate through. Additionally, it can also be customized and restricted so that only certain users can access certain features such as reporting, dashboards, or ML.
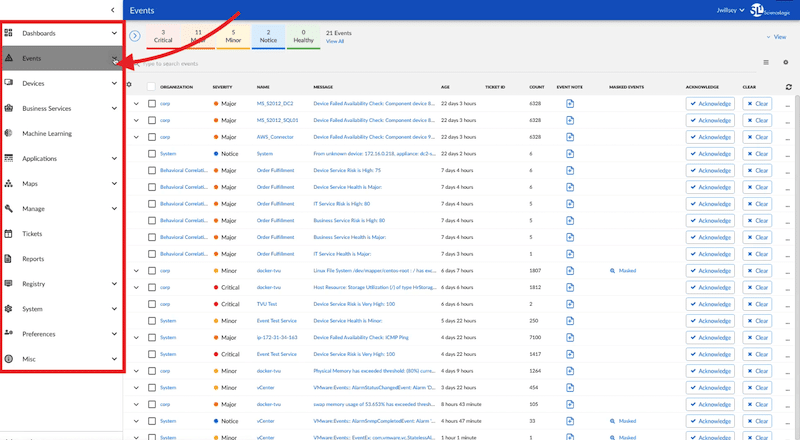
You’ll find the main navigation menu (which can be expanded with the menu icon). This menu includes Dashboards, Events, Devices, Business Services, Machine Learning, Applications, Maps, Manage, Tickets, Reports, Registry, System, Preferences, and Misc. Under each menu, you also find a sub-menu with more options.
Settings and Advanced Menu
The ScienceLogic SL1 platform also allows you to change the UI template from the pre-defined sample. In addition, you can also customize your theme. For example, you can upload and change the company logo, choose a lighter or darker UI, or modify the colors of the bars.
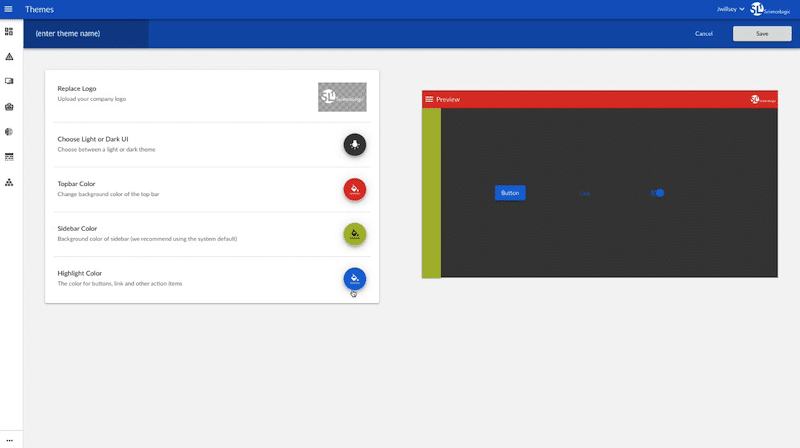
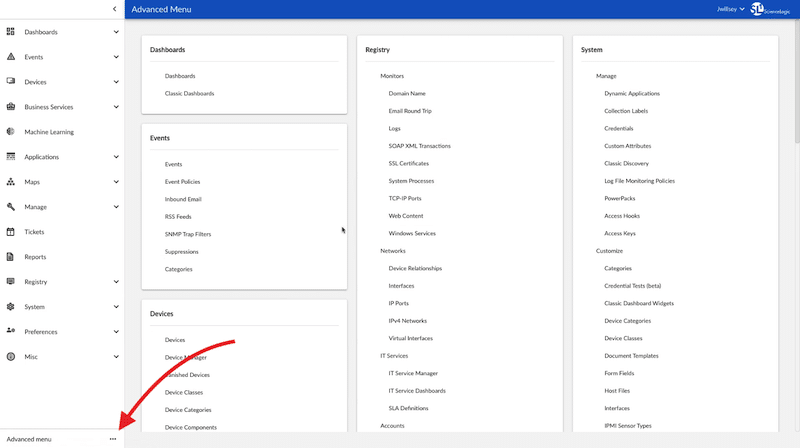
In the bottom left corner, you’ll find the Advanced Menu. This menu shows you an exhaustive list of all the items you can see in the UI.
The Events Page
As shown in the screenshot below, it displays all events categorized in different severity levels, from Critical, Major, Minor, Notice, and Healthy. It also shows additional helpful information such as the event’s name, message, age, ticket ID, whether it has been acknowledged, and more.
The Devices Page
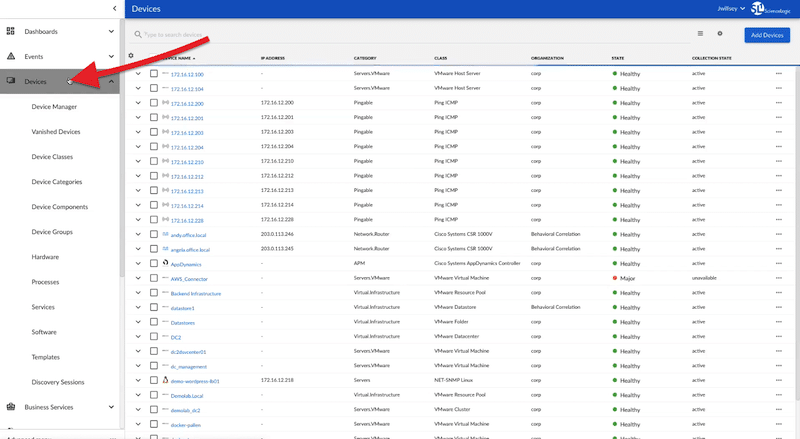
The Devices page shows a table view of all the devices, including name, IP address, category, class, organization, state, hostname, or ID. All the columns are adjustable, and alphanumerical values can sort their items. The Devices page also comes with search and filter capabilities so that you can look for specific devices using a search value.
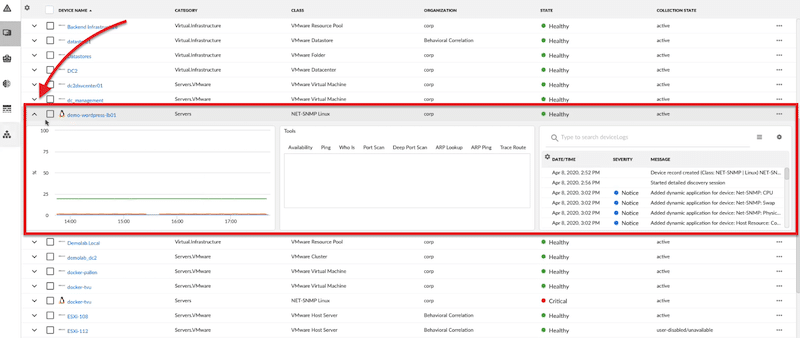
If you want to look closer at the metrics of each specific device, you can open the drop-down menu at the far left in the Events window. This will open a quick graphic, tools such as ping, traceroute, port scan, and the records or logs of the specific device.
If you want to know even more about the device, open the Device Investigator window by clicking on the device. This page provides more information such as CPU utilization, latency, memory, events, logs, maps, etc.
ScienceLogic SL1 Dashboards
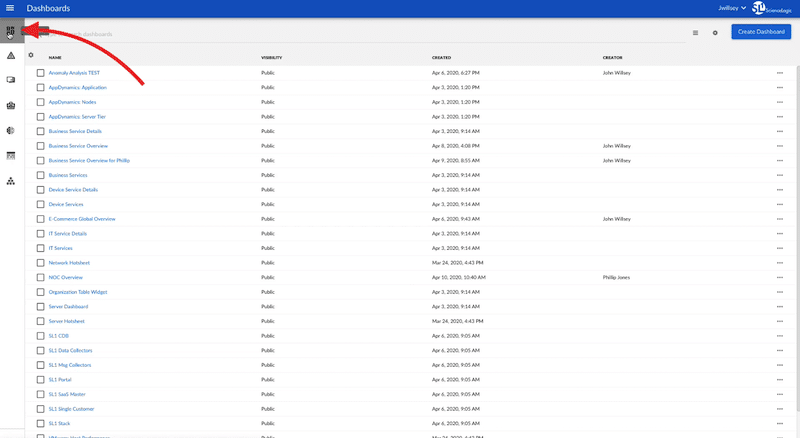
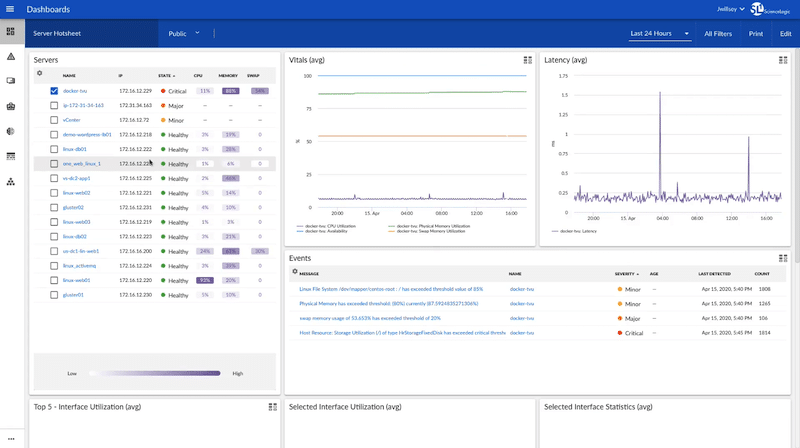
The Dashboard page displays graphical reports that are known as widgets. These reports show charts, tables, and text from the data collected. Dashboards can be private or public so that you can restrict access to specific dashboards based on login credentials.
To access your dashboards, click on the first icon in the left-hand vertical navigation bar.
Once you click on a specific dashboard, it will display the widgets, showing all necessary information. In addition, dashboards allow you to zoom in on devices when you want to get more context, insights, or monitoring.
ScienceLogic Alternatives
Organizations looking to keep up with their complex and distributed architectures turn to big data solutions that provide logs monitoring, AIOps, and observability capabilities. Solutions like ScienceLogic, based on AIOps, use big data, ML, and other modern analytics to improve IT operations with actionable insights.
Below are the top eight alternatives to ScienceLogic that provide any or all of those extensive data capabilities. These products can collect data from multiple sources, use real-time analytics, and provide outputs like automation or reporting.
Our methodology for selecting ScienceLogic alternatives:
We reviewed the market for ScienceLogic alternatives and analyzed tools based on the following criteria:
- Define your organization's specific needs, objectives, and challenges
- Compatibility and integration with your current IT environment
- Real-time performance monitoring capabilities
- Automation and orchestration capabilities
- Scalability and flexibility to evolve with changing needs
- User interface and ease of use
- Check reviews and references for the best options
- Consider your budget and support system before finalizing
1. Datadog
Datadog is an observability and Application Performance Monitoring (APM) platform designed for cloud-based applications. It performs data analytics to monitor servers, databases, tools, and third-party services. It also allows Machine Learning-based monitoring. With Datadog’s Webhooks integration and monitoring APIs, teams can create automated AIOps workflows.
Key Features:
- Acquire full visibility for modern infrastructure
- Analyze and explore log data
- Monitors user experience
- Traffic flow insights in cloud-native environments
- Real-time interactive dashboards
- Alerts for critical issues
Why do we recommend it?
Datadog provides a secure foundation for building, scaling, and managing cloud-based applications within the GCP environment. It has various comprehensive features to ensure a secure and efficient management framework for the development and operation of applications in the cloud.
Who is it recommended for?
It is strongly recommended for organizations and IT experts who often need to navigate the complexities of hybrid or multi-cloud environments. Its unified monitoring platform ensures end-to-end visibility, preventing data silos and facilitating smooth migration between platforms. This capability allows teams to effortlessly trace the flow of data, whether it's transitioning from on-premise setups to GCP or navigating through complex multi-cloud architectures.
Pros:
- Offers numerous real user monitors via templates and widgets
- Monitors both internally and externally giving network admins a holistic view of network performance and accessibility
- Changes made to the network are reflected in near real time
- Allows businesses to scale their monitoring efforts reliably through flexible pricing options
Cons:
- Would like to see a longer trial period for testing
Try a 14-day free trial.
EDITOR'S CHOICE
Datadog is one of our most preferred tools due to its exceptional Real User Monitoring (RUM). It offers valuable insights into front-end performance through the eyes of actual users, ensuring end-to-end visibility into user activities for both web and mobile applications. Overall, this helps to optimize user experiences and enhance overall application performance with precision and efficiency.
Download: Download a 14-Day Free Trial
Official Site: https://www.datadoghq.com/
OS: Cloud-Based
2. Dynatrace
Dynatrace is an all-in-one software-intelligence monitoring, automation, AIOps, business analytics, and cloud-observability platform. It simplifies complex and distributed cloud-based deployments with advanced and intelligent tools from a single platform.
Key Features:
- Fullstack monitoring using AI platform
- Infrastructure observability
- Distribution tracing and profiling
- Real-time protection from unexpected vulnerabilities
- Seamless digital experience
- Business analytics and security analytics
- Custom solutions and intelligent automation
Why do we recommend it?
Dynatrace has great security features, offering advanced threat protection, automated response, and forensic capabilities. Its robust security framework ensures comprehensive protection against evolving threats. Additionally, its business analytics empowers informed decision making in real-time, with customizable analytics providing valuable insights for strategic and operational enhancements.
Who is it recommended for?
This tool is helpful for experts and organizations seeking customized solutions with enterprise-grade extensibility. It is best for those who require flexibility to address diverse use cases and meet the unique requirements of their business or project.
Pros:
- Highly visual and customizable dashboards, excellent for enterprise NOCs
- Operates in the cloud, allowing it to be platform independent
- Leverages AI to provide baseline analysis and detect user behavior anomalies
Cons:
- Designed specifically for large networks, smaller organizations may find the product overwhelming
Sign up to Dynatrace to get a 15-day free trial.
3. Splunk
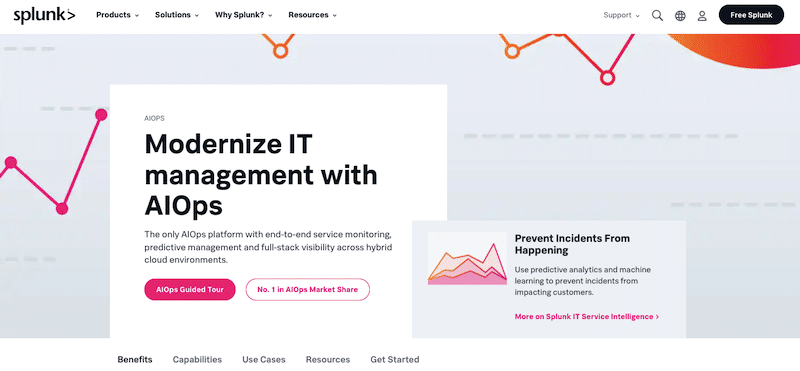
Splunk is a data platform commonly used for monitoring, searching, analyzing, and visualizing machine-generated data in real time and at scale. The Splunk platform integrates vital big data tools, including observability, event analytics and management, APM, AIOps, logs for observability, infrastructure monitoring, digital experience monitoring, and more.
Key Features:
- Advanced threat detection
- IT modernization
- Automation and artificial intelligence
- Monitoring of operational events
- Workload management
Why do we recommend it?
Splunk helps in preserving the security and continuity of digital systems. It helps fortify defenses against threat actors to minimize downtime and accelerate issue resolution to achieve enterprise resilience. Hence, Its comprehensive capabilities make it an indispensable tool for maintaining the robustness of digital infrastructure.
Who is it recommended for?
Splunk is used by cybersecurity experts, IT professionals, and data analysts due to its advanced capabilities in security information and event management (SIEM). Experts use this tool to gain actionable insights into system threats, monitor security incidents, and analyze vast datasets for proactive decision-making.
Pros:
- Excellent visuals to display collected data and insights
- Supports a multitude of environments for data collection
- Machine learning to identify new data sources and monitor behavior
- Excellent support with a wide range of integrations
Cons:
- Many features and services cater more to large enterprise networks
Get a free trial access to the Splunk Cloud for 14 days.
4. New Relic One
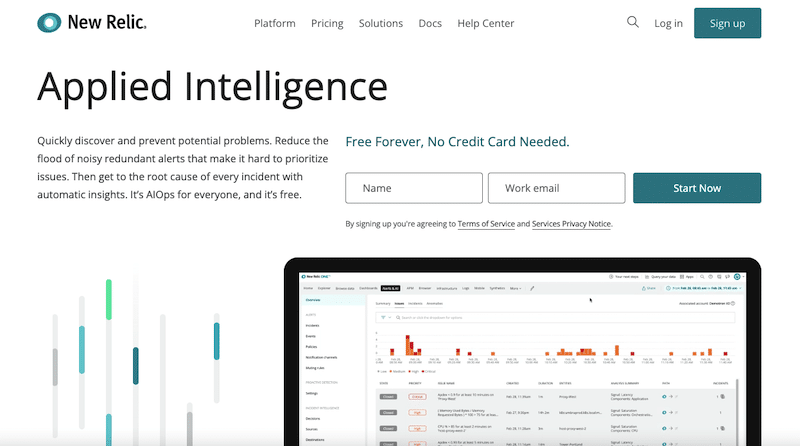
NewRelic One is a robust observability platform. It provides full-stack data analysis for all your software’s metrics logs and events. New Relic One also offers additional capabilities, including applied intelligence (AIOps), advanced alerting, APM, telemetry data management, and more.
Key Features:
- Web performance monitoring
- Serverless
- Supports SAP monitoring
- Real-time user monitoring
- Vulnerability management
Why do we recommend it?
NewRelic One's AI-powered analytics enable users to visualize, analyze, and swiftly resolve issues across the stack. With its intuitive interface and powerful insights, New Relic One empowers efficient troubleshooting and optimization, making it an indispensable tool for those aiming to enhance their overall system performance and reliability.
Who is it recommended for?
New Relic One is specifically used by IT professionals, DevOps engineers, and application performance monitoring experts for optimizing system performance, troubleshooting issues, and ensuring the overall health of applications. Experts use this tool for its powerful insights and efficiency in managing complex technology stacks.
Pros:
- Certified for Microsoft Azure monitoring
- Anamoly detection to highlight abnormal behavior in your Azure environment
- Simple but intuitive admin dashboards
Cons:
- Better suited for small to medium-sized Azure networks
Sign up to get a limited but perpetually free access license.
5. Broadcom AIOps
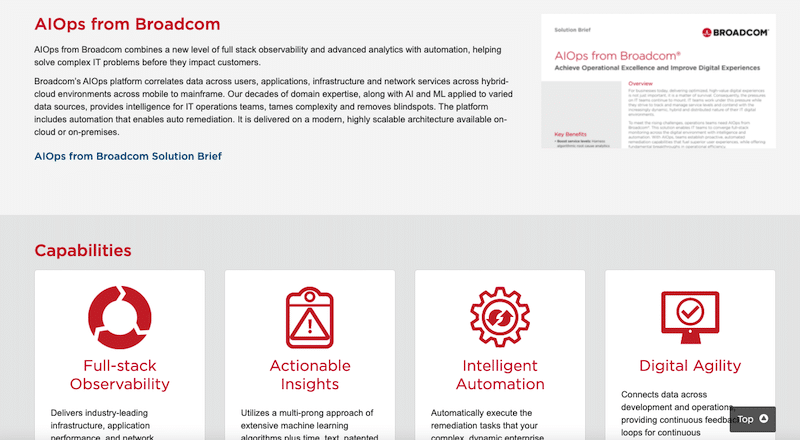
Broadcom is a semiconductor company that creates wireless and broadband communication products and software. Broadcom enterprise software solutions target product planning, DevOps, and IT Operations Management.
Key Features:
- Intelligent automation
- Customizable dashboards
- Application performance management
- Networking monitoring
- Advanced algorithms(AI/ML)
Why do we recommend it?
Broadcom AIOps is scalable, flexible, and has user-friendly automation. It helps to align with dynamic business and technical requirements to go with the ever-evolving landscape of IT operations. It simplifies complex processes and enhances efficiency and responsiveness. Its scalability ensures it grows with the organization's needs. On the other hand, it is suitable for automation and adaptable AIOps solutions to optimize other IT operations.
Who is it recommended for?
The Broadcom AIOps solution is specifically recommended for IT professionals, system administrators, and operations experts. It is a useful tool for multiple reasons, like it helps in presenting insights with rich contextual information through both out-of-the-box and fully customizable dashboards, making it an invaluable tool for those overseeing complex IT environments.
Pros:
- Automates tasks across multiple operating systems; Linux, Windows, macOS
- Great for diverse environments including BYOD setups
- Supports over 100k agents
Cons:
- Would like to see more workflow visualization options
- Not the best fit for smaller organizations
Broadcom provides a great AIOps solution with full-stack observability when it comes to IT operations.
6. Cisco AppDynamics
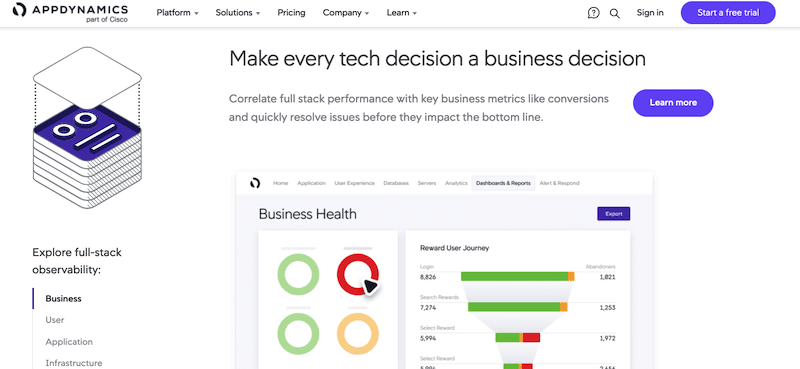
Cisco’s AppDynamics is full-stack observability, IT infrastructure monitoring, and APM platform. This product has been awarded as a Leader in Gartner’s 2021 Magic Quadrant for APM tools. The software can monitor the entire stack, from business, user, application, infrastructure, network, and security.
Key Features:
- Full-stack observability
- Hybrid work and cloud
- Infrastructure transformation
- Security resilience
Why do we recommend it?
Cisco AppDynamics helps to observe and visualize the entire technology stack, encompassing databases, servers, and both cloud-native and hybrid environments. This comprehensive insight empowers users to optimize performance, troubleshoot efficiently, and ensure the seamless operation of complex IT infrastructures.
Who is it recommended for?
Cisco AppDynamics is highly recommended for SAP experts and IT teams engaged in the monitoring and analysis of SAP production instances. It has specialized features that cater to the unique requirements of SAP environments, providing deeper insights and analysis.
Pros:
- Tailored for large-scale enterprise use
- Designed for full-stack monitoring, great if you plan to monitor other environments outside of Google Cloud
- Enhanced intelligent monitoring with AI
Cons:
- Steep learning curve, could use more tutorials
Get a 15-day SaaS trial.
7. LogicMonitor
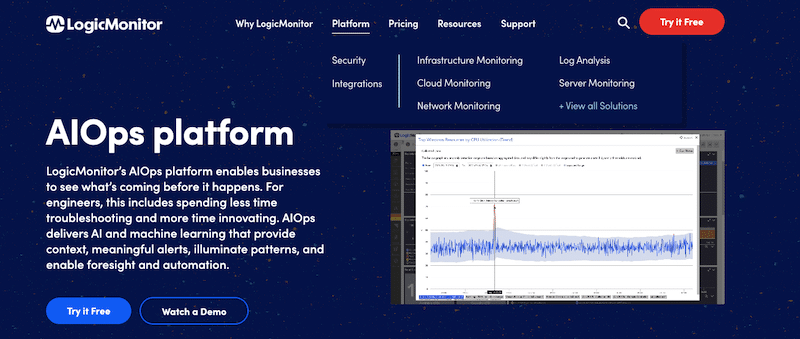
LogicMonitor is a cloud-based, fully automated infrastructure, network, server monitoring solution, and observability platform. It is designed for enterprise IT and managed service providers. In addition, LogicMonitor provides an AIOps platform that delivers AI and ML to give context, alerts, identify patterns and predictions, and enable automation.
Key Features:
- Performance and bandwidth monitoring
- Access controls and permissions
- Anomaly detection
- Activity/alerts and notifications tracking
Why do we recommend it?
LogicMonitor has exceptional capabilities that allow you to analyze, monitor, and track the performance metrics of organizational networks, servers, and applications. It is the best choice for organizations that suffer from complex network problems, as this tool has real-time monitoring to monitor server health.
Who is it recommended for?
This tool is used by system administrators and network engineers who constantly work on monitoring and management of diverse IT elements. This tool helps to perform synthetic transactions, conduct service checks on websites, and efficiently manage hardware, OS metrics, and applications, making it an ideal tool for experts seeking a unified solution for real-time monitoring.
Pros:
- Monitors application performance via the cloud
- Monitors assets in hybrid cloud environments
- Dashboard can be customized and saved, great for different NOC teams or individual users
- Better suited for enterprises and MSPs
Cons:
- The trial is only 14 days, would like to see a longer testing period
Sign up for a 14-day free trial.
8. Zenoss
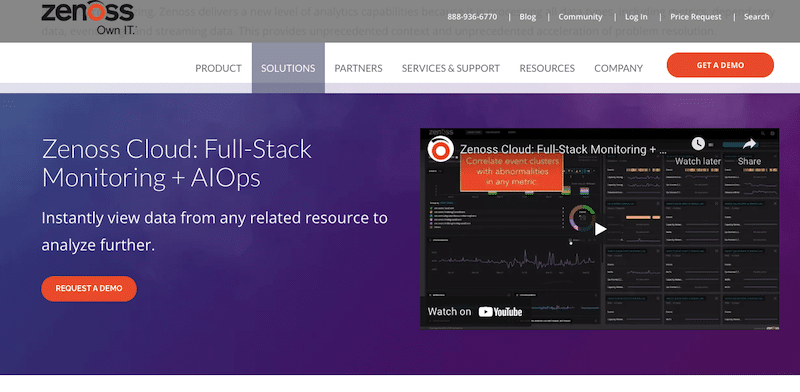
Zenoss is a SaaS-based intelligent IT operations management platform. It provides application and service monitoring and a robust AIOps solution. Zenoss can monitor full-stack, including cloud, on-premise, hybrid or multi-cloud environments.
Key Features:
- Log analytics
- Hybrid IT monitoring
- Network and storage monitoring
- Event management and correlation
Why do we recommend it?
Zenoss offers a comprehensive support package that allows seamless setup and deployment lifecycle management. It has other options ranging from startup assistance to full rollout packages, allowing you to tailor to unique needs of each user.
Who is it recommended for?
IT professionals who aim to uncover hidden patterns, trends, and dependencies within their IT infrastructure find this tool useful. It has advanced analytics capabilities, which allows to identify potential issues that could impact other IT services in the future. This makes it an ideal tool for experts seeking proactive insights and actionable intelligence to stay ahead of potential challenges.
Pros:
- Open-source, completely free tool with two paid options
- Network discovery to automatically pull in new devices that enter the network
- Supports multi-site networks encompassing both LAN and WAN
- Wide range of Cisco ACI plugins offered by the Zenoss community
Cons:
- Support only for paid tiers
- Dashboard interface needs improvement, specifically the nested menu options on the home screen
Register to try Zenoss Cloud for free.
Final Verdict
This review evaluated ScienceLogic’s flagship product, the SL1, which is the singular AIOps and infrastructure monitoring platform. IT operations teams can leverage ScienceLogic SL1 to get actionable insights. As a result, they can predict, detect, and resolve IT problems faster, with valuable insights.
You can’t try their product for free, but you can request a demo. You can also test ScienceLogic’s alternatives, as shown in this review if you look for something with different capabilities.