We may earn a commission if you make a purchase through the links on our website.
Sensu Beginner’s Guide

UPDATED: April 26, 2023
Sensu is a fantastic observability solution with incredible extensibility, scalability, and flexibility. With Sensu, you can basically observe your cloud, on-premise, virtual machines, containers, applications, services, or any resource that generates metrics, logs, and events. Once you start using Sensu, you'll get expanded visibility that is hard to get with traditional observability tools.
In this Sensu Beginner’s guide to Sensu, you’ll learn everything there is to know about starting with Sensu. You’ll understand its technical background, how it works, and how to begin implementing it in your network. You will also learn how to install the Sensu backend, CLI, and use the WebUI. In the last section, you will also learn how to install its clients and start sending data to the backend to observe it.
Table of Contents
- Introduction to Sensu
- What is Sensu?
- Sensu’s background
- Product details
- How does Sensu works?
- Sensu’s architecture
- The observability pipeline
- How to start with Sensu?
- Downloading and Installing Sensu Go Backend on Ubuntu 22.04
- Using and opening the Web UI
- Installing Sensu Go CLI
- Installing the Sensu agent
- Why would you need to use Sensu?
- The benefits of using Sensu
1. Introduction to Sensu
a. What is Sensu?
Sensu (by Sumo Logic) is a leading open-source monitoring solution originally designed for distributed applications and ephemeral infrastructure. It was developed to collect performance and health data from these apps and infrastructure and provide insights and diagnostics.
Sensu can be used for scale by environments of any size, including enterprises, SMBs (Small-to-Medium Businesses), startups, and even individuals. This solution is extremely extensible and flexible. It can be extended via turnkey integrations, plugins, APIs, etc., to improve its capabilities and coverage. Sensu is also flexible because users can configure its monitoring via code.
b. Product details
- How is Sensu available? You can get Sensu on a backend server via Docker containers, 32-bit and 64-bit packages, or Linux or binary distributions. When it comes to the Sensu agent, it is available for popular platforms like Windows, Linux, macOS, and more.
- Who uses Sensu? Sensu’s monitoring as code is used among DevOps and SRE teams to expand the visibility of their infrastructure. Other teams like network and systems managers can also use Sensu to monitor small-to-large scale environments across on-premise to cloud.
- Integrations. To extend Sensu’s functionality and introduce automatic monitoring and observability, Sensu allows various integrations via plugins, libraries, and runtimes. You can integrate Sensu with alerting and incident management tools (Email, Slack, Jira, etc.), automation (Ansible, Rundeck, etc.), deregistration (Chef, Puppet, etc.), and time-series and long-term event storage (Elasticsearch, Prometheus, Sumo Logic, Graphite, etc.).
- Price and plans. Sensu Go is available in three different plans, Free, Pro, and Enterprise. Sensu Go Free version ($0) is suitable for individual users or small teams. Sensu Pro (starting at $3/month/node) is good for SMBs and large teams. Sensu Go Enterprise (starting at $5/month/node) is suitable for large teams running mission-critical infrastructure. Both Pro and Enterprise prices are paid annually.
- Free trial and demo. You can register to Sensu to start a 14-day free trial of the Sensu Pro and Enterprise plans and unlock the maximum number of nodes (3000) and sites that can be monitored. With this trial, you can also get better commercial support and features. Additionally, you can also check how the product works via a live and free demo.
- Support. You can get Sensu support from the community or in-house experts. If you buy Sensu, you’ll get enterprise (or premium) support with a good SLA and response time. You can reach them via the help desk, email, or phone. In addition, whether you are using Sensu for free or buying it, you’ll get access to their fantastic documentation database.
c. Sensu’s Background
In 2017, Sensu re-wrote and released their open-source monitoring software using Go and named Sensu Go OSS. Sensu Go is now the commercial version of the monitoring and observability solution aimed at enterprises. Sensu Go aims to give DevOps and SRE teams more visibility into their infrastructure (servers, containers, apps, cloud, etc.) and automate their monitoring.
In June 2022, Sumo Logic, a leader in continuous intelligence, acquired Sensu. The idea of Sumo Logic behind this acquisition was, first, to engage in open-source projects and, second, to accelerate Sumo Logic’s observability strategy. Now, as of 2022, Sensu’s approach to monitoring has been reworked into an observability pipeline that delivers monitoring as code.
2. How does Sensu work?
a. Sensu’s architecture
Sensu’s observability pipeline is divided into two vital aspects: Entity and Backend. An entity generates events via agents installed in their respective infrastructure, system, or application. Sensu’s agents are lightweight processes running on the components that want to be observed or monitored. The agent also helps discover resources, performs service checks (received from a scheduling engine), and provides metrics.
Once installed on a host, the Sensu agent registers with the Sensu backend and immediately starts feeding data (logs, metrics, events) into Sensu’s observability pipeline. Sensu uses this data to give the right context to the status and metrics checks.
Sensu also has a good number of APIs to allow integration, configuration, and data input from external resources, such as Nagios, StatsD, Prometheus, etc. Sensu’s APIs allow you to access events and workflows using a central control plane.

The second component of Sensu is the backend. Sensu’s backend is the service that gets the observability data. This component manages and schedules check requests. It also includes an event pipeline that filters, transforms, and processes incoming events. Sensu’s backend also provides a data store for saving configuration and state.
b. The observability pipeline
An observability solution, such as Sensu, helps get the data out from the infrastructure and applications in order to observe and secure its state. Rather than having to use many tools, such as log analytics, monitoring, SIEM, UBAs, and more, to achieve this, Sensu integrates all such capabilities into one. The observability pipeline unifies the data collection and processing for any type of event (including logs, metrics, and traces) in a single backend. With this solution, there is less need to use various agents with redundant instrumentation.
3. How to start with Sensu?
As you learn in the previous section, Sensu uses agents and a backend server. So, to show you how to start with Sensu, we will install and configure both.
The Sensu backend includes additional components like the Sensu API, a web UI, and a Command Line Interface (CLI). You can install the backend, Web UI, and CLI on Docker or Linux distributions such as Ubuntu/Debian and RHEL/CentOS. The Sensu agent, on the other hand, is multi-platform so you can install it on Windows, Linux, and macOS.
We will install Sensu Backend on an Ubuntu server, the Sensu CLI on the same Ubuntu machine, and the agent on a Windows Server 2022.
a. Downloading and Installing Sensu Go Backend on Ubuntu 22.04
To begin with Sensu, you’ll need to follow these steps.
- Use the following commands to update your package repository:
$ sudo apt update
- Use the following command to add the Sensu repository
$ sudo curl -s https://packagecloud.io/install/repositories/sensu/stable/script.deb.sh | sudo bash

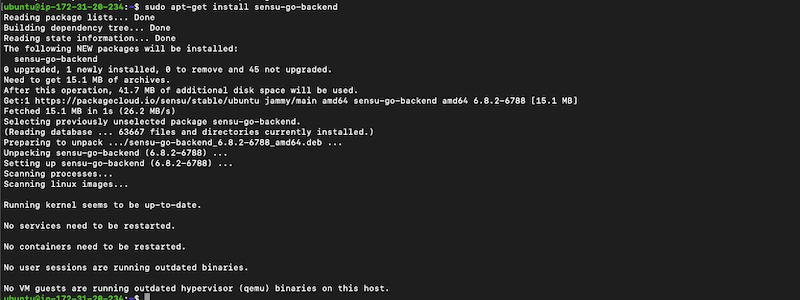
- Now, let’s install the “sensu-go-backend” package. Use the following command:
$ sudo apt-get install sensu-go-backend
- How to configure the Sensu backend? You can either configure the Sensu backend through the “sensu-backend start” flags or via the “backend.yml” file. Start by copying the configuration “backend.yml” template. Use the following command.
$ sudo curl -L https://docs.sensu.io/sensu-go/latest/files/backend.yml -o /etc/sensu/backend.yml

- Use the service manager to start the “sensu-backend” service and ensure it is active and running. Use the following commands:
$ sudo systemctl start sensu-backend
$ sudo systemctl status sensu-backend

- Now, let’s create admin credentials for the backend.
- In this step, you’ll need to ensure the sensu-backend is running and use the sensu-backend flag to configure environment variables with username and password strings. For example,
$ export SENSU_BACKEND_CLUSTER_ADMIN_USERNAME=PCWD
$ export SENSU_BACKEND_CLUSTER_ADMIN_PASSWORD=PASS123
$ sensu-backend init

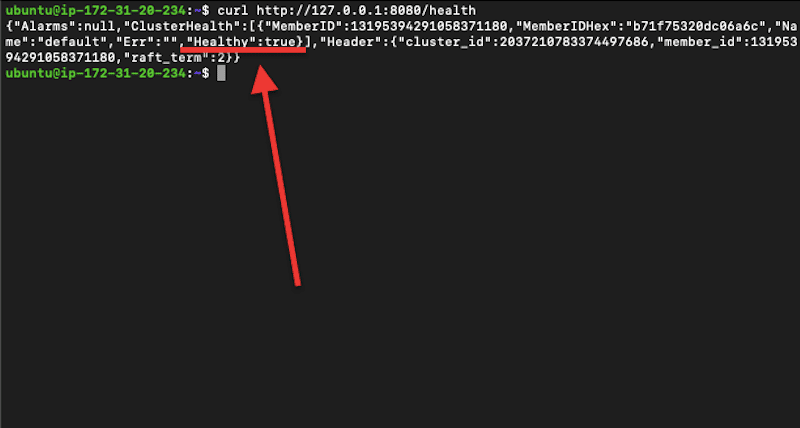
- Let’s ensure the backend is up and healthy with the Sensu /health API endpoint. This API provides HTTP GET access to important health data.
- Use the following command on your command line or issue from the browser. In our case, we have installed the backend on the same machine we are testing, thus the localhost address (127.0.0.1), but you could also use this API endpoint to test remotely from agents, just make sure you input the correct backend IP address.
$ curl http://127.0.0.1:8080/health
- If you got the- “Healthy”: true-within the response (as shown in the screenshot below), it means that your backend is up and healthy.
b. Using and opening the Web UI
The Sensu Web UI provides a unified view of all your events, checks, and entities. It summarizes the infrastructure’s health, active incidents, types of entities, and more. Although the Sensu Web UI is a part of the Sensu backend architecture, it is available as a separate standalone commercial product.
The Sensu Web UI is not distributed inside the Sensu backend binary, but it is available in the Sensu Go distribution package. To find this commercial distribution, go to sensu.io/downloads.
How to open the Sensu Web UI?
- If the Sensu backend is running, you can open the Web UI by typing the IP address of the Sensu backend (or, in our case, localhost) followed by port 3000: For example, http://localhost:3000
- The web UI will prompt you for credentials. If you have already configured it, as we did in the previous section, enter your credentials.
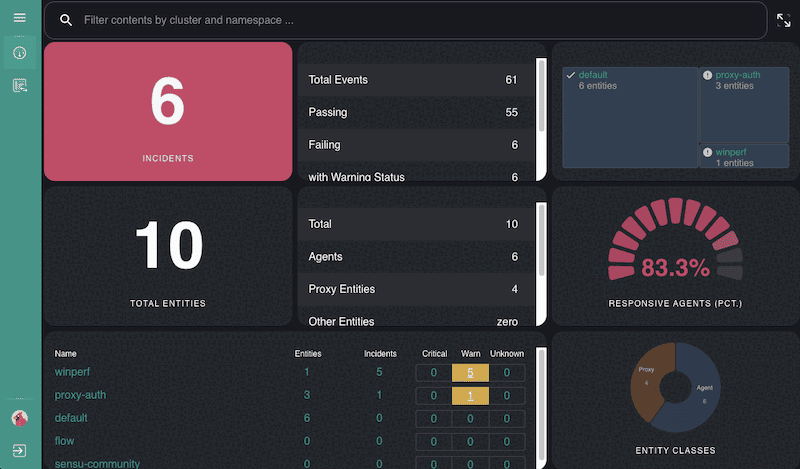
- If you have configured agents (more on this in the next section) and your Sensu backend is receiving data, the Sensu Web UI should start displaying data.
c. Installing Sensu Go CLI
Sensu comes with a command line interface (CLI) tool known as “Sensuctl,” which allows you to manage the resources within Sensu. Sensuctl calls Sensu’s API to create, read, or delete events or resources. You can install Sensu CLI on Linux, Windows, and macOS.
Let’s install Sensuctl on an Ubuntu machine
- To add or update the Sensu repository (as we previously did), issue the following command:
$ curl -s https://packagecloud.io/install/repositories/sensu/stable/script.deb.sh | sudo bash
- Use the following command to install the sensu-go-cli package.
$ sudo apt-get install sensu-go-cli

- To start using Sensu’s CLI, you’ll need to configure it first with a few parameters. Use the following command to configure Sensuctl:
$ sensuctl configure
- A menu will open, where you will be able to see your user profile. Set up Sensuctl with a particular authentication method, its backend API URL, namespace, output format, and username/password (the ones we set up before).

4. Installing the Sensu agent
As mentioned before, the Sensu agent can be installed on Windows (7 and later, or Server 2008 R2 and later), Ubuntu (14.04 – 22.04), Debian (8 – 11), RHEL/CentOS (6 – 9), and Docker (Docker images are available for Linux-based containers). In addition, Sensu also provides binary-only distributions available in .zip and .tar.gz formats. This includes different architectures from popular platforms like Linux, Windows, macOS, FreeBSD, and Solaris.
As mentioned at the beginning of the previous section, we will install the Sensu agent on a Windows Server 2022. To install the Sensu agent in Windows, we have three options, the Windows Installer (MSI), Windows Binaries (amd64 or 386), or manual installation from Chocolatey Repositories.
- Download the Sensu agent. We are going to download the Sensu agent from the sensu.io/downloads official site.
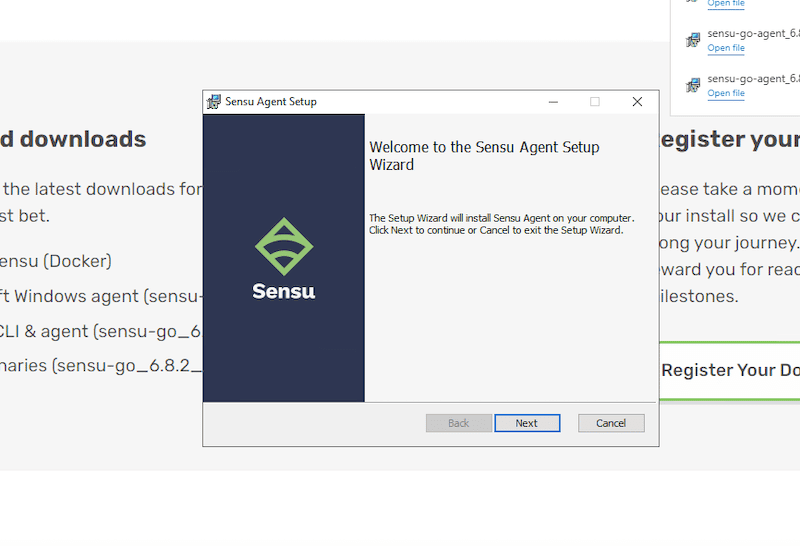
- Install the Sensu Agent. Install the agent following the setup wizard. The installation process for Windows is straightforward. Just choose a destination folder, and follow the instructions.
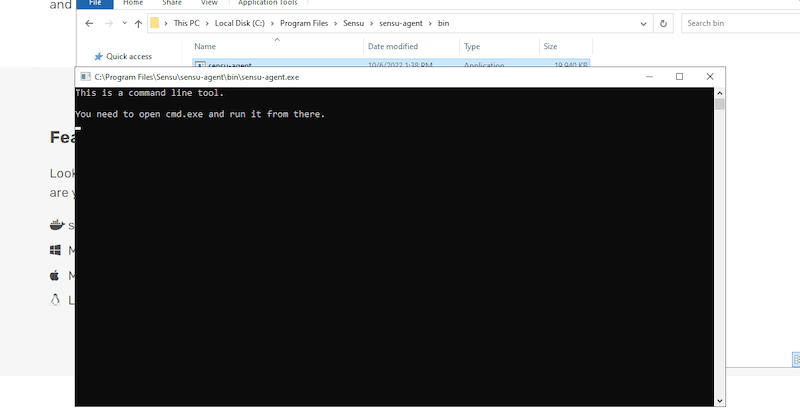
- Opening the Sensu agent. We installed the Sensu agent in the default destination folder (C:\Program Files\Sensu\sensu-agent\bin). If you attempt to open the sensu-agent.exe installed in this folder, you will see the following message: “This is a command line tool. You need to open cmd.exe and run it from there”.
- Configuring the Sensu agent. Similar to the Sensu backend, you can also configure Sensu agent via the “agent.yml” file or through the “sensu-backend start” flags.
- To learn how to configure the Sensu Windows agent via the configuration file, let’s download and check an example of the Sensu agent configuration file.
- When you open this agent.yml file (as shown in the screenshot below), you’ll notice a list with the check and hook commands that the agent can execute. This configuration file is also available in JSON format.
- The agent’s configuration is highly customizable. You can change it by modifying the configuration file (YAML or JSON).
- For Windows (and Linux), you can modify environment variables, and for Linux only, you can change command line flag arguments.
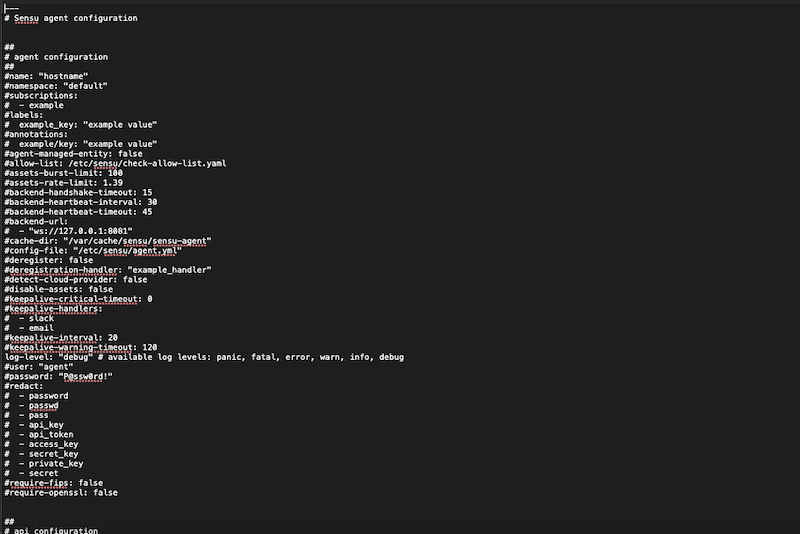
- The agent’s installation also comes with an agent.yml example file. You can find this agent.yml.example file under C:\ProgramData\Sensu\config (by default).
- You can remove the “.example” extension to leave the file with a .yml file extension. You can also copy the downloaded agent.yml example file into this folder.

- Now, to configure the sensu-agent via flags, let’s open sensu-agent.exe from the Windows Command Prompt (cmd) with admin rights.
- Go to the directory where you installed Sensu, by default, cd ‘C:\Program Files\sensu\sensu-agent\bin'
- Run the executable: sensu-agent.exe
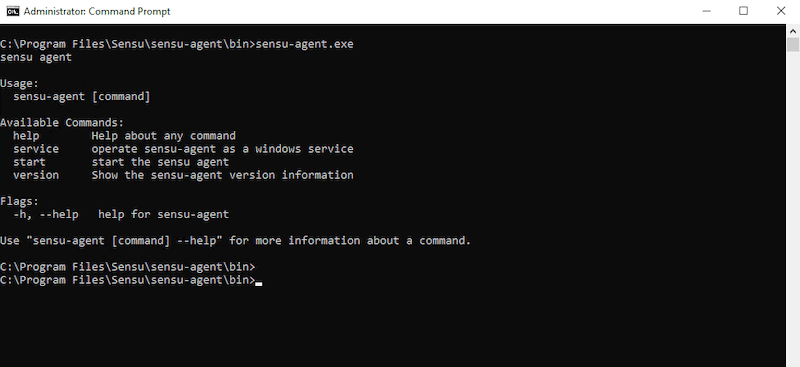
- As soon as you run the sensu-agent.exe, you will get a short manual with the available command. You’ll have four options: help, service, start, and version.
- Let’s operate the sensu-agent as a Windows service with the ‘service’ command. Issue the following command to install and start the service.
- Sensu-agent service install

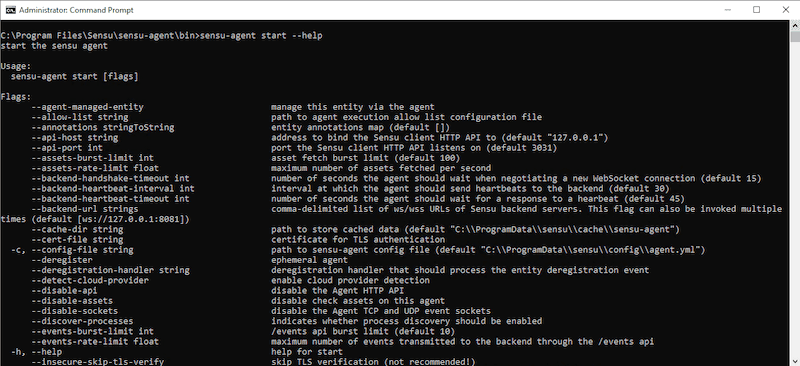
- You can now configure the Sensu agent using flags. Use the following list of sensu-agent start commands by entering the line ‘sensu-agent start –help’
5. Why would you need to use Sensu?
The traditional observability approach is only good if the data collected (logs, metrics, and traces) is understood within context. Unfortunately, a lacking of context leaves gaps in the observability efforts, which can ultimately impact the ability to understand, monitor, and manage services correctly.
Sensu’s end-to-end observability pipeline can help fill these observability gaps between metrics, logs, and traces. With Sensu, you should be able to collect, filter, transform and process events using an observability pipeline. Sensu can use results to give the proper context for status and metrics checks. Plus, all these events can be immediately sent to a database or time series and long-term event storage.
a. The benefits of using Sensu
- Auto-discovery Sensu’s agents will automatically discover nodes, containers, VMs, cloud computing instances, and any service running on them. Once found, the Sensu agent will register them to the backend server.
- Monitoring as code With Sensu’s Go declarative configuration files, monitoring can be treated as code. It can be shared, edited, reviewed, or changed. Monitoring as code provides insights into all the processes and changes across the pipeline.
- Automatic scaling Another advantage of using Sensu is its automatic scaling. Aside from being able to monitor tens of thousands of nodes from a single cluster, Sensu can automatically register and deregister servers, devices, containers, apps, and functions anywhere they are deployed in the cloud, on-premises, or on multi-clouds.
- Turnkey integrations Quick and easy integrations with the tools you already use, including data collection (event logs, health checks, metrics, etc.), monitoring, storage, and alerting. With Sensu, you can combine existing monitoring tools such as StatsD, Nagios, Prometheus, or more into one.
- Manage alerts and incidents Sensu’s integrations allow you to send alerts via email, Slack, or SMS. With Sensu’s alerting integrations, you create and resolve incidents with incident management platforms like JIRA, PagerDuty, or ServiceNow.
- Robust system and service monitoring Collect system metrics, including CPU, memory, and disk usage. Gather app metrics, collect logs, and send them to a database. Keep track of container infrastructure from Kubernetes, Docker, Red Hat OpenShift, Mesos, and Cloud Foundry.
- Implement security Introduce or improve the security of your Sensu agents. Use Sensu SSO (Single Sign On) providers to lock down user access. The Sensu agent can also be configured to automate identity with various methods.
- Automate actions for diagnosis and self-healing Aside from just observing and monitoring your infrastructure or services, Sensu can also be configured to detect specific problems, trigger service restarts or execute custom scripts. Integrate IT automation platforms such as Ansible.